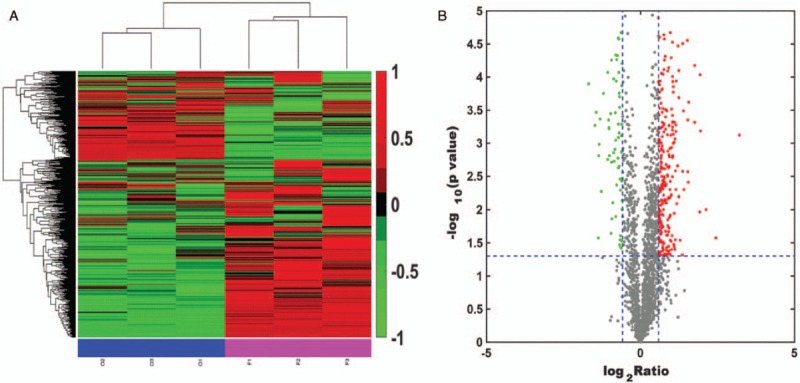
Figure 1.

Identification of differentially expressed proteins in a farnesol-exposed group (sample F) relative to a farnesol-unexposed group (sample O). (A) O1, O2, and O3 represent three replicates of sample O; F1, F2, and F3 represent three replicates of sample F. Each column represents a sample, and each line represents a gene. Proteins with similar expression patterns in different samples are clustered together. Red represents up-regulation, and green represents down-regulation. (B) Volcano plot representing protein abundance changes (F [farnesol-exposed group] vs. O [farnesol-unexposed group]). The X-axis presents the protein quantification ratio (F/O); the Y-axis presents the P-values from replicate experiments. Each point represents a protein. Red points are up-regulated proteins, and green points are down-regulated proteins.
