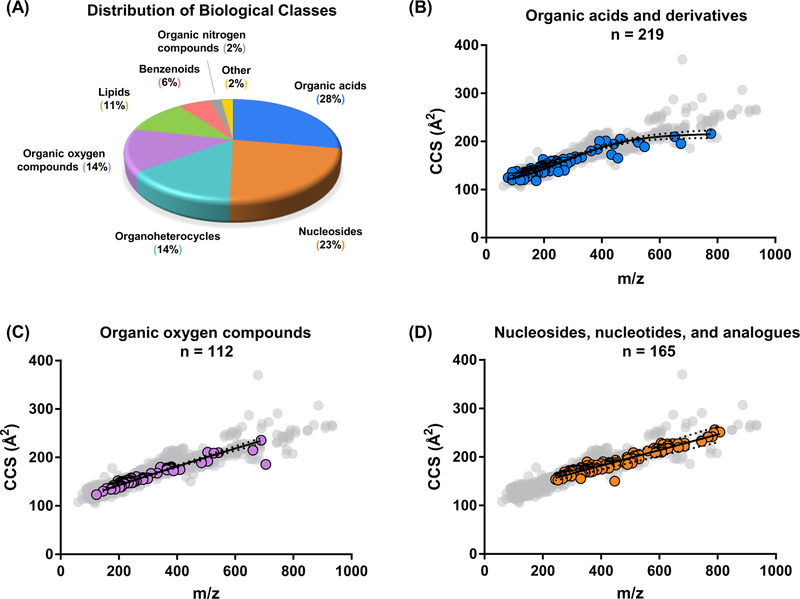
Figure 1.
(A) Distribution of biological categories associated with the primary metabolites examined in the MSMLS plate library. (B, C, and D) Conformational space plots of three singly charged molecular super classes contained in the MSMLS library. Representative nonlinear regression fits (solid black lines) along with 99 % confidence intervals (black dotted lines) are shown for each. Gray dots denote all molecules CCS values obtained in the library. All CCS error bars are smaller than their respective symbols. (B) “Organic acids and derivatives” with a 4-parameter sigmoidal fit. (C) “Organic oxygen compounds” with a power fit and (D) “Nucleosides, nucleotides, and analogues” with a power fit.

