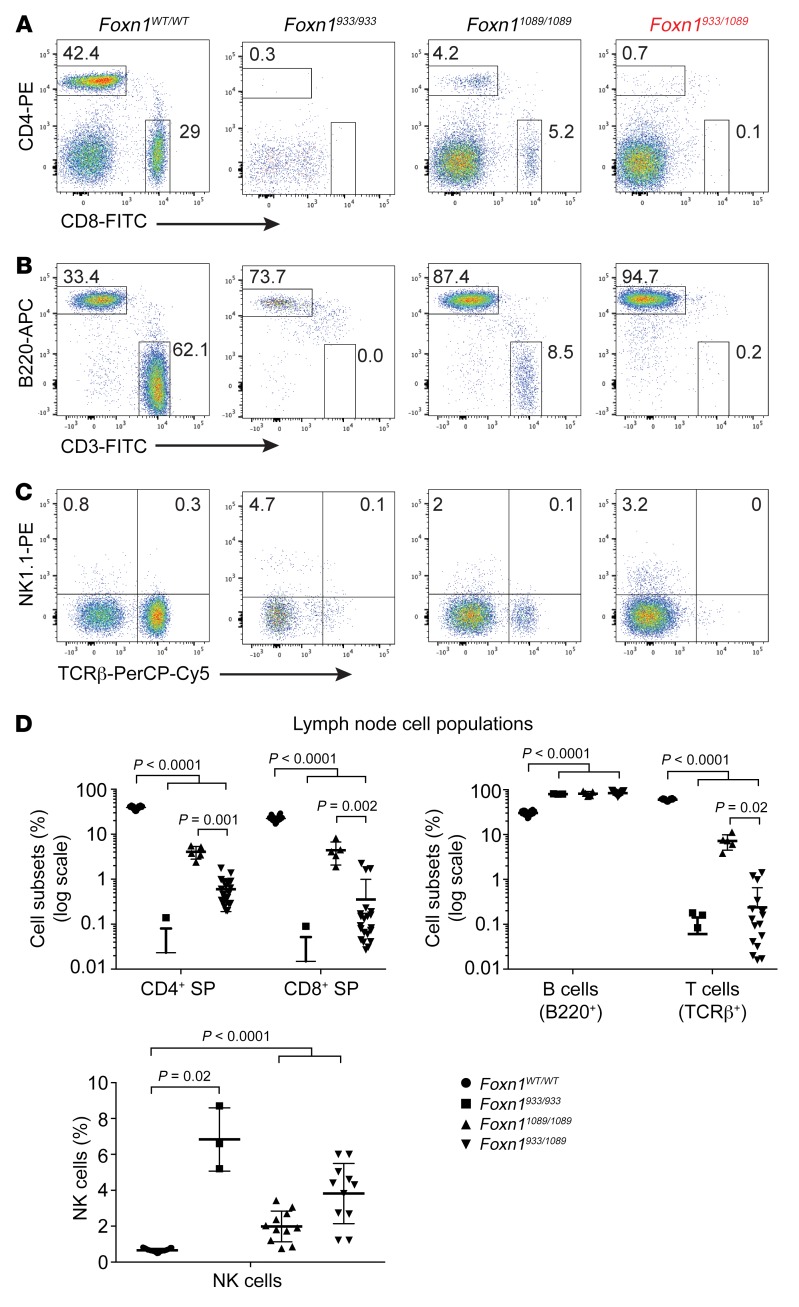
Figure 4. Mice with compound heterozygous mutations in Foxn1 have severe peripheral T cell lymphopenia.
(A–C) Lymph nodes were collected from the indicated mice and stained with antibodies detecting cell-surface CD4, CD8, B220, TCRβ, and NK1.1 expression. The cells were analyzed by flow cytometry comparing the cell-surface expression of (A) CD4+ and CD8+ SP cells; (B) B220 (marker of B cells) and CD3ε cell-surface expression; and (C) NK1.1 cell-surface expression and TCRβ. n = 3 to 26 mice per genotype for A–C. APC, allophycocyanin. (D) The percentages of CD4+ SP cells, CD8+ SP cells, B200+ B cells, and CD3ε+ T cells were calculated; n = 24 Foxn1WT/WT, n = 5 Foxn1933/933, n = 11 Foxn11089/1089, and n = 21 Foxn1933/1089 mice. The percentages of NK1.1+ TCRβ– cells were calculated; n = 26 Foxn1WT/WT, n = 3 Foxn1933/933, n = 11 Foxn11089/1089, and n = 11 Foxn1933/1089 mice. For the comparisons shown, a Brown-Forsythe and Welch’s 1-way ANOVA was applied. P values of less than 0.05 were considered significant.

