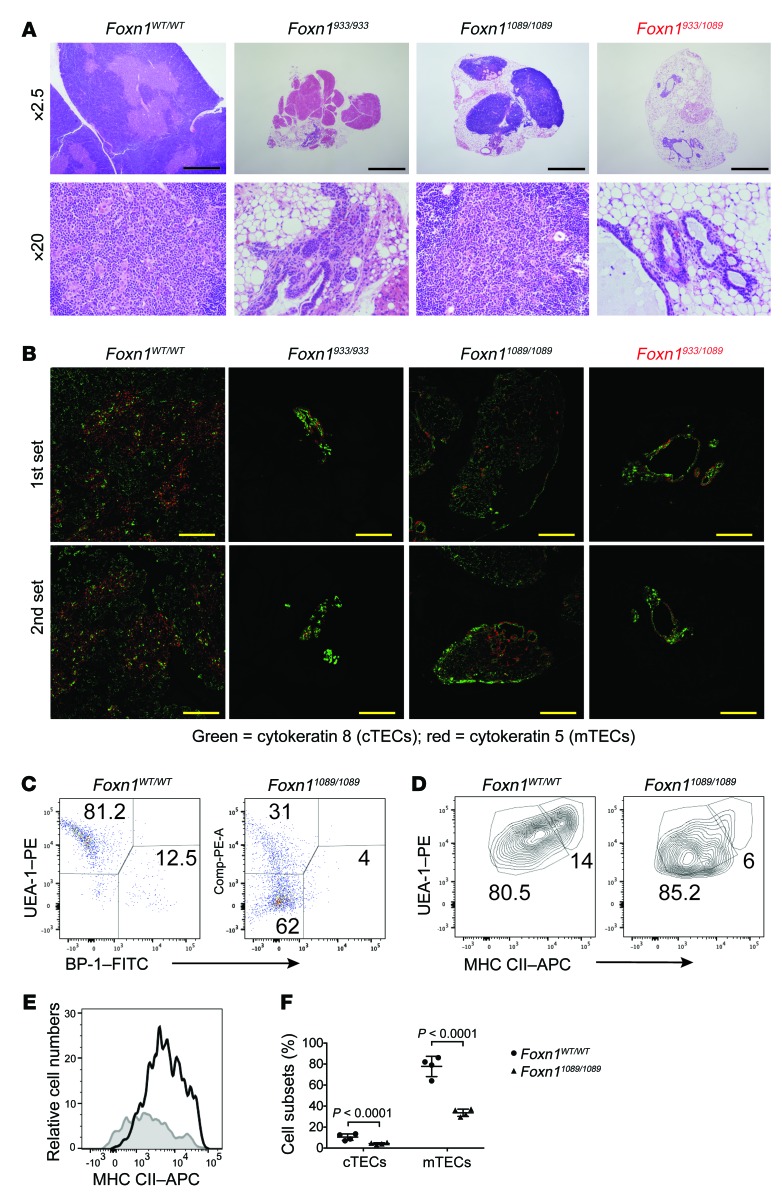
Figure 5. The thymic architecture is severely disrupted in mice with homozygous and compound heterozygous Foxn1 mutations that genocopied Pt. 1.
(A) Thymi were isolated from mice of the indicated genotypes (32–45 days old) and processed for H&E staining. Sections are shown at different magnifications to illustrate the severe thymic aplasia in the Foxn1933/933 and Foxn1933/1089 genotypes. Scale bars: 1 mm. (B) IHC was performed on thymic tissue sections with antibodies detecting cTECs (cytokeratin 8) and mTECs (cytokeratin 5). Two independent tissue samples were used per genotype and were labeled as the first set and second set. Scale bars: 0.5 mm. (C) Dispersed thymic tissues were prepared from mice of the indicated genotypes, and TECs were compared by flow cytometry, first by gating on EpCAM+CD45– cells with antibodies detecting cTECs (BP-1) and mTECs (UEA-1) along with the cell-surface levels of MHC CII. (D and E) mTEC populations (UEA-1) were costained with antibodies detecting MHC CII in mice of the indicated genotypes, and dot blot comparisons are shown. (E) The MHC CII expression was compared between control littermates (black line) and Foxn11089/1089 mice (gray line). (F) The percentage of the different cTEC and mTEC subsets in the thymus of the indicated mice was calculated (n = 4 mice/group). Statistical analysis was performed using a Student’s t test.

