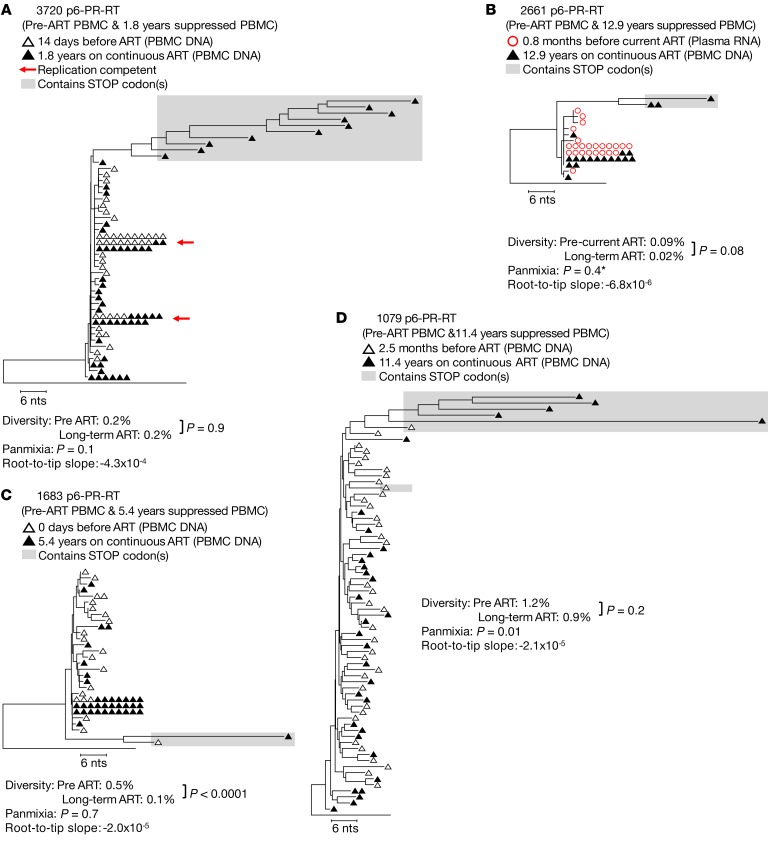
Figure 1. HIV-1 P6-PR-RT proviral DNA and plasma virus RNA sequences prior to and during long-term ART.
Neighbor joining trees were constructed from single-genome P6-PR-RT proviral DNA sequences obtained from PBMCs (hollow black triangles; A, C, and D) or RNA sequences obtained from plasma virus (hollow red circles; B) prior to the most recent period of continuous viral suppression on ART and proviral DNA sequences obtained from PBMC samples taken after 1.8–12.9 years of viral suppression on ART (solid black triangles). Diversity was measured by APD, and measures were compared using an unpaired t test. Divergence was measured by a test for panmixia (to correct for multiple comparisons, populations are considered to be statistically different when the probability of panmixia is less than 0.001). Red arrows indicate sequences matching virus obtained in a viral outgrowth assay (30). Root-to-tip distances were measured using maximum likelihood trees, and the slopes of the root-to-tip distances over time were calculated by linear regression (units for slopes are substitutions/year). In cases where the slope was positive, an F-test was used to determine if the root-to-tip slopes were significantly different from zero. A is rooted on the HIV-1 subtype C consensus sequence, and B–D are rooted on the subtype B consensus sequence. Sequences containing G to A hypermutations and/or stop codons in open reading frames (indicated by shaded boxes) were excluded from all analyses. Except where unique variants were too few to test statistically (indicated by *), rakes of identical sequences were collapsed to a single variant for the test for panmixia and branch-length analysis. Results from a total of 8 samples (2 samples each from 4 patients) are represented in this figure.

