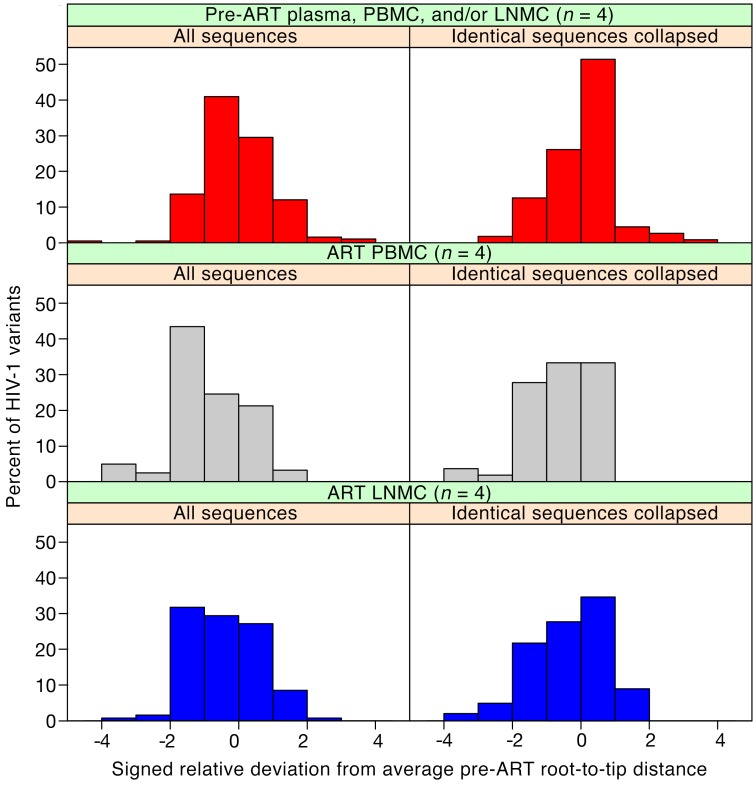
Figure 6. HIV-1 root-to-tip distances normalized to pre-ART average.
Signed relative standard deviations were calculated for each sequence (including either all sequences or only each distinct variant) from each patient, as described in Methods. These data were separated into categories of pre-ART, on-ART PBMCs, and on-ART LNMCs, and the values from all patients were aggregated and plotted separately for each group in red, grey, and blue for pre-ART, on-ART PBMCs, and on-ART LNMCs, respectively, in bin sizes of 1 SD. A negative relative standard deviation indicates a regression from the mean and a positive value indicates an increase from the mean. Patient 2669 was excluded from this analysis due to lack of pre-ART sampling. Sequences from patient 2661 included pre-ART plasma sequence data, and sequences from patient 3720 included both pre-ART PBMC and LNMC data. All sequences containing G to A hypermutation and/or stop codons in open reading frames were excluded from the analysis. The number of samples for each panel was 4.

