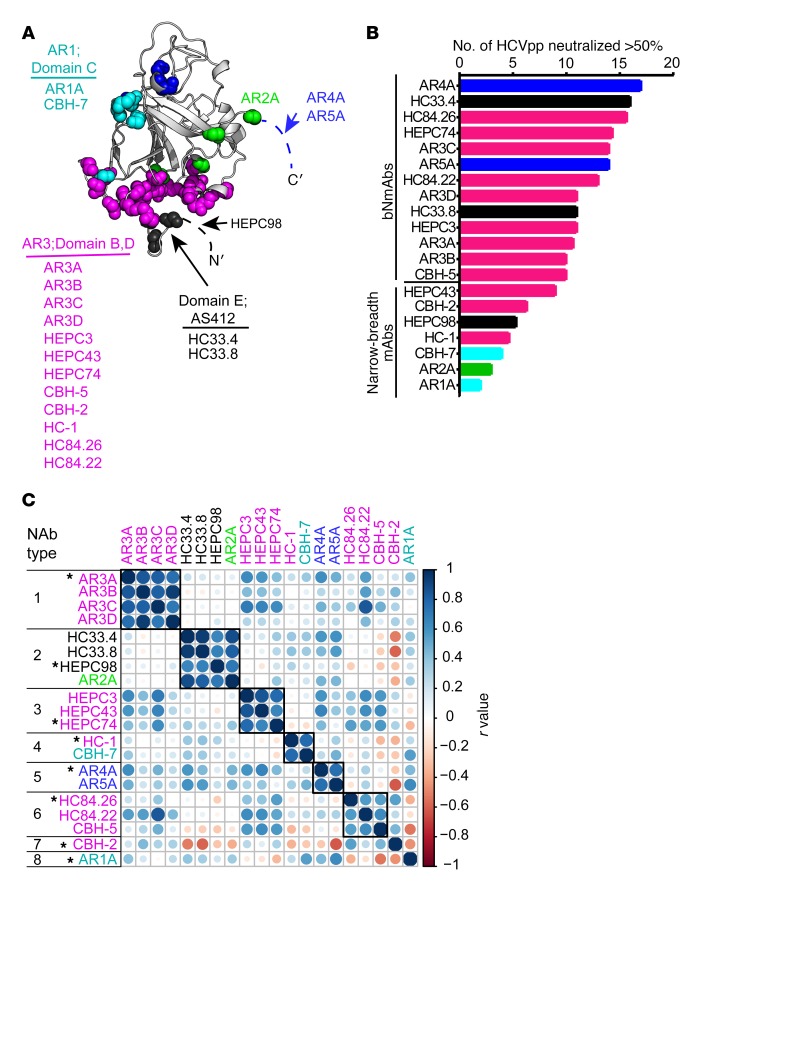
Figure 2. Selection of a reference mAb panel.
(A) Main-chain atoms of previously defined mAb binding residues identified by alanine-scanning mutagenesis (see Methods) marked with colored spheres on the crystallized structure of the HCV E2 protein ectodomain (gray), strain 1b09, PDB accession 6MEI (15), with colors modified in PyMOL, v1.8.6.2. For clarity, a maximum of 5 residues with impact on binding of each mAb are marked. Antigenic domains/antigenic regions (ARs) are indicated, and mAbs highlighted with the same color share multiple binding residues. Dashed lines indicate a disordered region (HVR1) or part of the E2 protein truncated to aid crystallization (stem region of E2). Putative AR4A and AR5A binding residues on E1 are not shown. (B) Neutralizing breadth of reference mAbs at 10 μg/mL measured with a panel of 19 genotype 1 HCVpp, with a threshold of 50% neutralization considered positive. (C) Functional grouping of reference mAbs. For each mAb, neutralization of each of 19 HCVpp was measured in duplicate, generating a neutralization profile (i.e., ranking of relative neutralization of each HCVpp) (Supplemental Figure 2), and pairwise Pearson correlations were measured between these neutralization profiles. Circles at each intersection of the heatmap are scaled by the magnitude of the correlation (r) between the indicated NAbs. mAbs were grouped into an NAb type if the neutralization profile of each mAb in the group had a correlation of greater than or equal to 0.55 with every other mAb in the group. One representative mAb (indicated with an asterisk) was selected from each NAb type to form the final panel of 8 reference mAbs.

