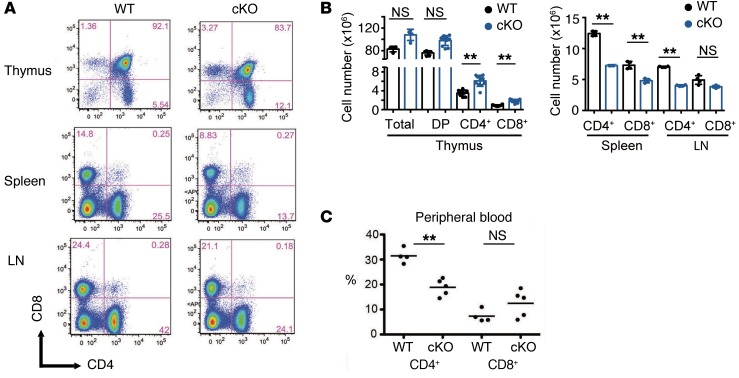
Figure 1. Analysis of T cell populations in different organs of WT and Jmjd3-cKO mice.
(A) Flow cytometry analysis of CD4 and CD8 SP T cells in the thymus, spleen, and LN from WT and Jmjd3-cKO mice. (B) Absolute cell numbers for different cell populations, including total, DP, CD4 SP (CD4+), and CD8 SP (CD8+) cells in the thymus, spleens and LNs from WT and Jmjd3-cKO mice (n = 8/group, from 2 independent experiments). Data are reported as mean + SD from 3 independent experiments. **P < 0.01, Student’s t test. (C) Percentages of CD4+ and CD8+ cells in the peripheral blood from WT and Jmjd3-cKO mice. Circles represent individual mice, and lines represent the mean. n = 4/5. **P < 0.01, Student’s t test. NS, no significant differences.

