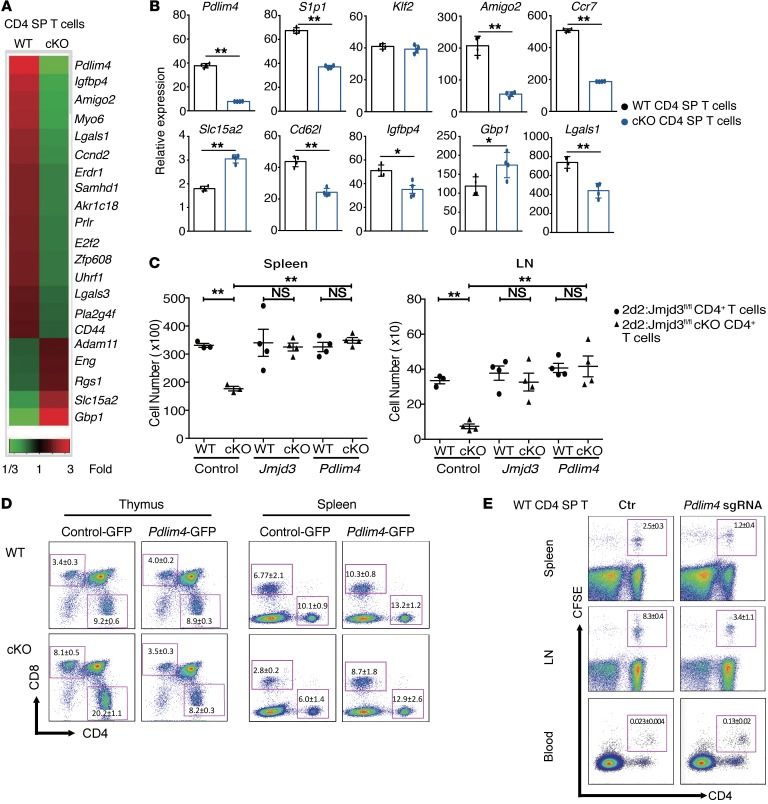
Figure 3. Identification of the JMJD3 target genes in CD4+ T cells and functional rescue of T cell defects by ectopic expression of Pdlim4.
(A) Heatmap from microarray analysis of upregulated and downregulated genes in WT and Jmjd3-cKO thymic CD4 SP T cells. (B) Real-time PCR analysis of a panel of genes between WT and Jmjd3-cKO thymic CD4 SP T cells. Expression levels are given as the ratio of the target gene to the control gene to correct for variations in the starting amount of mRNA (gene/Gapdh ×1000). n = 4. *P < 0.05; **P < 0.01, Student’s t test. (C) CD4+ T cells from 2D2:Jmjd3fl/fl (WT) mice or 2D2:Jmjd3-cKO mice were activated with MOG35–55 peptide in vitro before transduction with GFP-expressing retroviral vectors containing Jmjd3 or Pdlim4. Equal numbers of GFP+CD4+ T cells were intravenously injected into sublethally irradiated C57BL/6 mice (n = 4). Absolute numbers of TCRVα3.2+/Vβ11+GFP+CD4+ T cells in spleens and LNs were determined by flow cytometry 48 hours after adoptive transfer. Data are presented as mean + SD from 3 independent experiments. **P < 0.01, 1-way ANOVA with Tukey’s multiple comparisons test. (D) WT and Jmjd3-cKO bone marrow cells overexpressing control GFP or Pdlim4-GFP were transplanted into lethally irradiated C57BL/6 (WT) mice to generate chimeric mice. Flow cytometric analysis of CD4+ and CD8+ T cells from the thymus and the spleens of chimeric mice. n = 3/group; 1 experiment. (E) Thymic CD4 SP T cells were isolated from WT mice. Pdlim4 KO was generated using the CRISPR-Cas9 system. Cells were labeled with CFSE and then intravenously injected into sublethally irradiated C57BL/6 mice. After 48 hours, spleens, LNs, and peripheral blood were analyzed by flow cytometry for CD4+ and CFSE-stained cells. Experiments were repeated 3 independent times. n = 3/group; 1 experiment.

