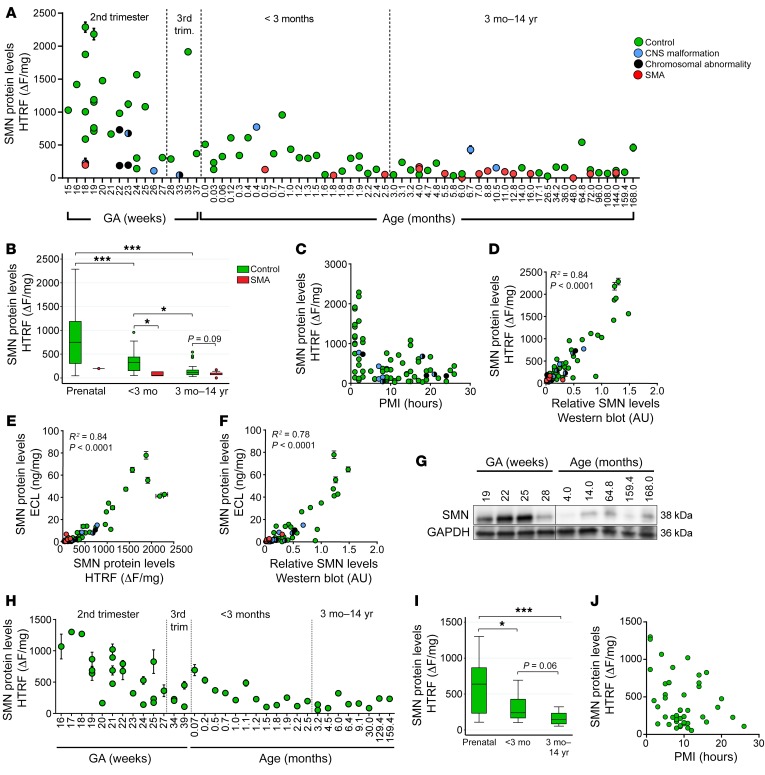
Figure 2. Spinal cord and cortex SMN protein levels are higher in fetal samples than in postnatal samples.
(A) SMN protein expression quantified by HTRF in spinal cord samples (n = 75 control; n = 16 SMA patients) ranging in age from 15 weeks gestation (GA) to 168 months. (B) Medians, interquartile range (box), and 95th percentiles (whiskers) of data from A. (C) Scatter blot of PMI against SMN protein expression in control samples. (D–F) Correlations between SMN protein measured by (D) HTRF and Western blot, (E) ECL and HTRF, and (F) ECL and Western blot. (G) Representative Western blot of SMN expression in prenatal and postnatal control samples. All lanes were run on a single gel. Black line indicates discontinuous lanes. (H) SMN protein expression quantified by HTRF in cortex samples (n = 44 control) ranging in age from 16 weeks gestation to 159.4 months. (I) Medians, interquartile range (box), and 95th percentiles (whiskers) of data from H. (J) Scatter plot of PMI against SMN protein expression in all control cortex samples. SMN molecular weight = 38 kDa; GAPDH molecular weight = 36 kDa. *P < 0.05; ***P < 0.001, representing statistical analysis performed before multiple comparisons. P values of pairwise comparison of medians were calculated using Wilcoxon’s rank-sum test. Prenatal SMA group excluded in all statistical analyses. Adjustment for multiple comparisons was applied to control groups between time points. The α level was set to 0.0167 (0.05/3) using Bonferroni’s adjustment.

