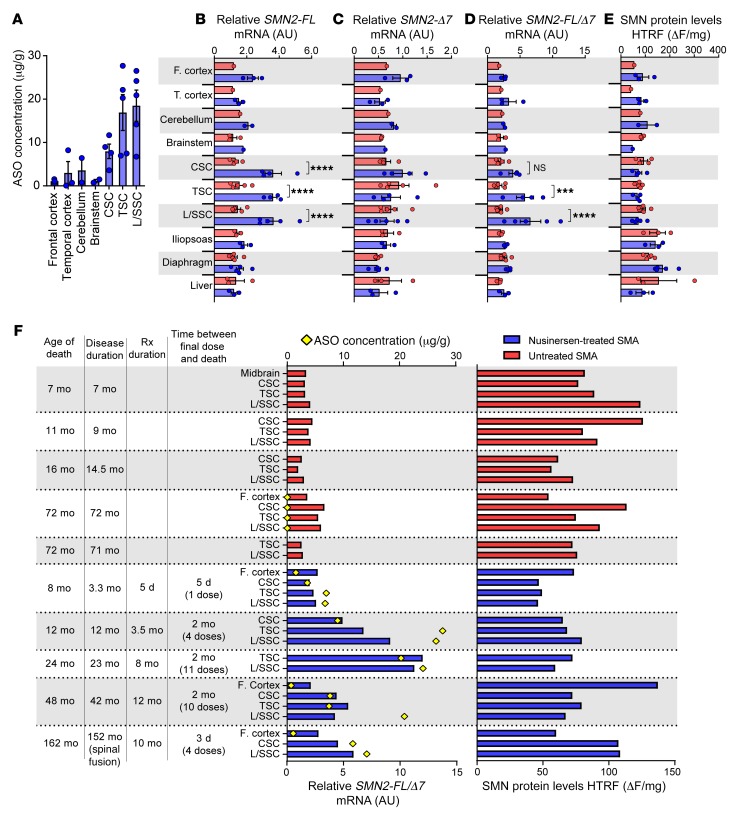
Figure 7. SMN mRNA induction in spinal cord, but not other CNS or peripheral tissues in nusinersen-treated SMA cases.
(A) Concentration of ASO quantified from various CNS tissues of nusinersen-treated SMA patients. (B–D) Relative amount of (B) SMN2-FL mRNA, (C) SMN2-Δ7 mRNA, (D) ratio of SMN2-FL/Δ7 mRNA in CNS and non-CNS tissues of nusinersen-treated SMA patients (n = 1–5, depending on tissue) compared with that of untreated SMA patients (n = 1–5, depending on tissue). (E) SMN protein expression measured in whole tissue by HTRF. (F) Case-by-case SMN induction (SMN2-FL/Δ7) and protein expression in whole spinal cord of nusinersen-treated SMA cases and untreated SMA controls. ASO concentration in each tissue indicated with a yellow diamond. Data are represented as median ± SEM. ***P < 0.001; ****P < 0.0001. Statistical analysis was performed using 2-way ANOVA (B, C, D, and E) and corrected for multiple comparisons for tissues with n ≥ 3. Rx, nusinersen treatment; CSC, cervical spinal cord; TSC, thoracic spinal cord; L/SSC, lumbar/sacral spinal cord.

