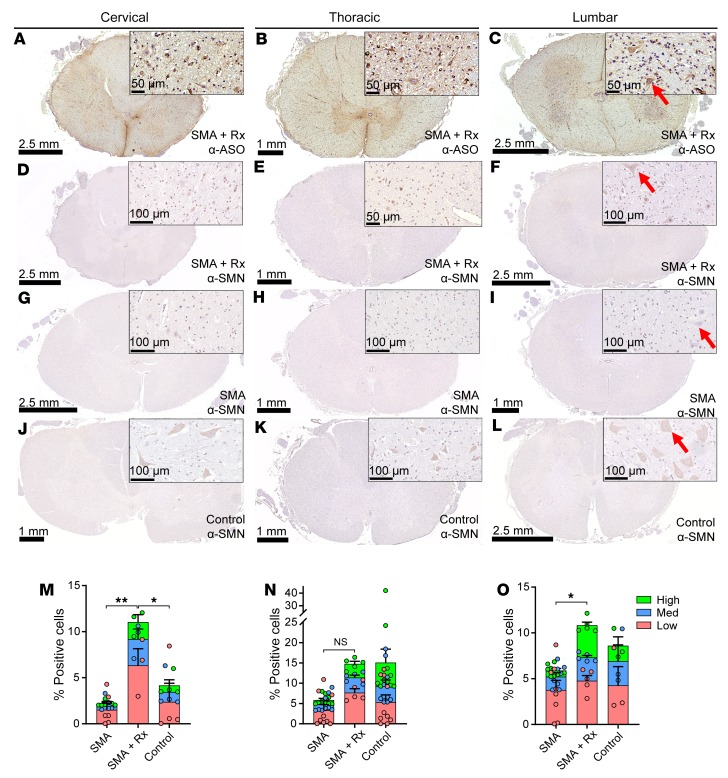
Figure 8. ASO and SMN IHC in nusinersen-treated patient spinal cords.
(A–C) IHC for the ASO in (A) cervical, (B) thoracic, and (C) lumbar spinal cord of nusinersen-treated SMA patients. (D–L) IHC for SMN in cervical (D, G, and J), thoracic (E, H, and K), and lumbar (F, I, and L) spinal cord of nusinersen-treated SMA patient (D–F), untreated SMA patient (G–I), and untreated control (J–L). High-power images shown in insets. Scale bars are indicated for each image. Arrows depict ventral horn neurons. (M–O) Percentages of cells expressing low-, medium-, or high-intensity level of SMN staining in (M) cervical, (N) thoracic, and (O) lumbar spinal cord of untreated (SMA, n = 6–9), nusinersen-treated controls (SMA + Rx, n = 3–5), or untreated controls (n = 3–10). Statistical analysis was performed using 2-way ANOVA and corrected for multiple comparisons. *P < 0.05; **P < 0.01. Cervical spinal cord: SMA vs. SMA + Rx (low SMN): P < 0.01; SMA + Rx vs. control (low SMN): P < 0.05. Lumbar spinal cord: SMA vs SMA + Rx (high SMN): P < 0.01.

