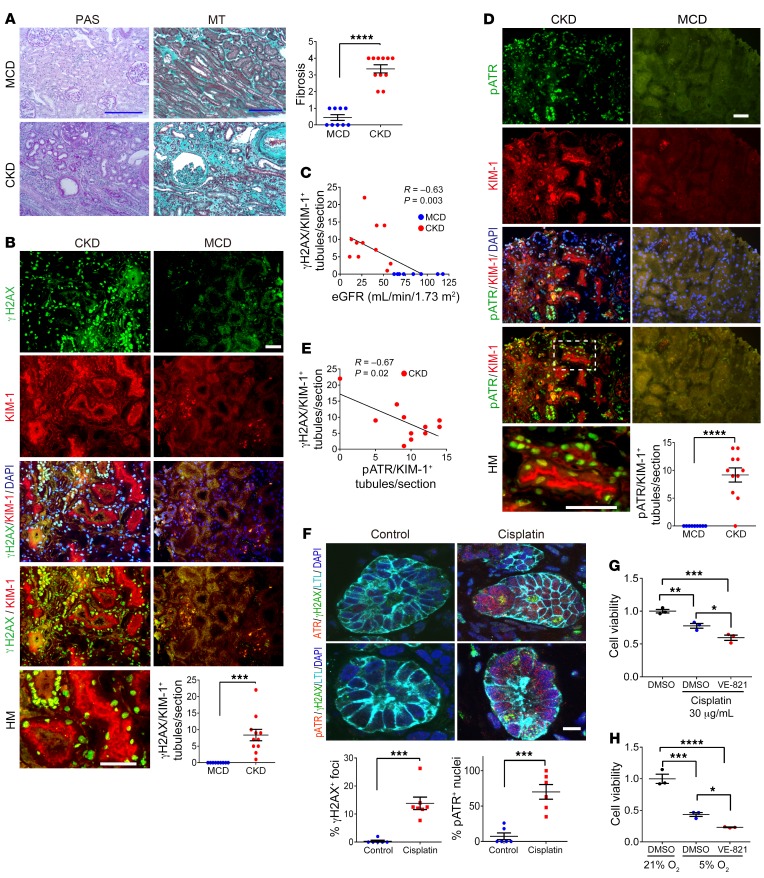
Figure 1. ATR and DNA activation in human kidneys and organoids.
(A) Representative images of periodic acid–Schiff (PAS) and MT staining of human kidney tissue and the corresponding quantitation of MT+ areas. Scale bars: 10 μm. (B) Representative images of γH2AX- and KIM-1–stained sections of human kidneys and the corresponding quantitation of γH2AX+/KIM-1+ tubules. Scale bars: 10 μm. (C) Correlation between the number of γH2AX+/KIM-1+ tubules and eGFR. (D) Representative images of pATR- and KIM-1–stained sections of human kidney and the corresponding quantitation of pATR/KIM-1+ tubules. Scale bar: 10 μm. (E) Relationship between γH2AX and pATR expression in KIM-1+ chronically injured RPTECs. (F) Representative images of H9 cell–derived day-49 organoids treated with either cisplatin (5 μM) or vehicle (RPMI) for 24 hours. Sections of the organoids were stained for ATR, pATR, γH2AX, and LTL. Scale bar: 20 μm. Dot plots show quantitation of pATR+ nuclei (n = 6, control; n = 6, cisplatin) and γH2AX+ nuclei in the organoids (n = 6, control; n = 7, cisplatin). (G) Viability of HKC-8 cells assessed 24 hours after cisplatin treatment, with or without 10 μM VE-821 pretreatment. Viability was determined using the MTT assay. Data are expressed as a percentage of the control MTT value (n = 3). (H) Viability of HKC-8 cells was assessed by MTT assay immediately following culturing under 21% or 5% O2 for 24 hours, with or without 10 μM VE-821 pretreatment. n = 9, MCD; n = 11, CKD (A–E). Data are presented as the mean ± SEM. A 2-tailed, unpaired t test (A, B, D, and F), 1-way ANOVA with Tukey’s post hoc test (G and H), and Pearson’s correlation analysis (C and E) were used to determine statistical significance. *P < 0.05, **P < 0.01, ***P < 0.001, and ****P < 0.0001. HM, high-magnification.

