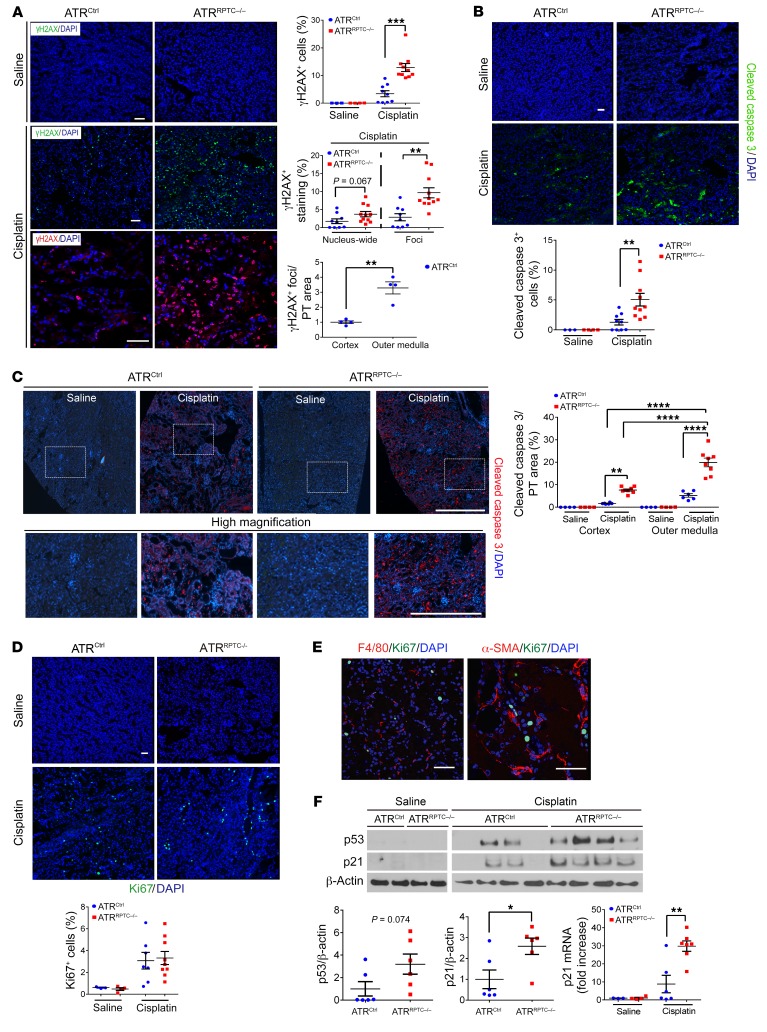
Figure 3. ATRRPTC–/– mice have enhanced DNA damage and apoptosis after cisplatin injection.
(A) Representative images of γH2AX-stained kidney sections from ATRCtrl and ATRRPTC–/– mice 96 hours after saline or cisplatin injection. Scale bars: 50 μm. Dot plots show quantification of γH2AX+ cells, percentage of cells with nucleus-wide γH2AX+ staining or γH2AX+ foci, and γH2AX+ cells in cortex versus outer medulla. Saline: ATRCtrl (n = 3), ATRRPTC–/– (n = 4); cisplatin: ATRCtrl (n = 9), ATRRPTC–/– (n = 11). (B) Representative images of cleaved caspase 3–stained kidney sections from ATRCtrl and ATRRPTC–/– mice 96 hours after saline or cisplatin injection. Scale bar: 50 μm. Dot plot shows corresponding quantification of cleaved caspase 3+ cells. Saline: ATRCtrl (n = 3), ATRRPTC–/– (n = 4); cisplatin: ATRCtrl (n = 9), ATRRPTC–/– (n = 11). (C) Immunostaining for cleaved caspase 3 and DAPI in kidneys from ATRCtrl and ATRRPTC–/– mice 96 hours after saline or cisplatin injection. Upper panels: Stitched images represent approximately 25% of the kidney cross-sectional area (original magnification, ×200). Lower panels: Higher-magnification images from the boxed regions in the stitched (upper) images (scale bar: 500 μm). Dot plot shows quantification of cleaved caspase 3 staining from the whole kidney section images in C relative to the LTL+ area of uninjured kidney tissue. Saline: ATRCtrl (n = 4), ATRRPTC–/– (n = 4); cisplatin: ATRCtrl (n = 6), ATRRPTC–/– (n = 8). (D) Representative images of Ki67-stained kidney sections from ATRCtrl and ATRRPTC–/– mice 96 hours after saline or cisplatin injection. Scale bar: 50 μm. Dot plot shows corresponding quantification of Ki67+ cells. Saline: ATRCtrl (n = 3), ATRRPTC–/– (n = 4); cisplatin: ATRCtrl (n = 7), ATRRPTC–/– (n = 9). (E) Representative images of F4/80- and Ki67-stained and α-SMA– and Ki67-stained sections of injured kidneys from ATRRPTC–/– mice 96 hours after cisplatin injection. Scale bar: 50 μm. (F) Representative Western blot. Each lane represents 1 sample from an individual mouse. Dot plots show quantification of Western blot band intensity for p53 and p21, 96 hours after cisplatin injection. ATRCtrl (n = 6), ATRRPTC–/– (n = 6). Also shown is a dot plot of quantitative RT-PCR analysis of p21 mRNA levels in ATRCtrl and ATRRPTC–/– kidneys. Saline: ATRCtrl (n = 3), ATRRPTC–/– (n = 4); cisplatin: ATRCtrl (n = 6), ATRRPTC–/– (n = 7). Data are presented as the mean ± SEM. Statistical significance was determined by 2-tailed, unpaired t test (A, B, D, and F, for cisplatin ATRCtrl vs. cisplatin ATRRPTC–/–) and 1-way ANOVA followed by Tukey’s post-hoc test (C). *P < 0.05, **P < 0.01, ***P <0.001, and ****P < 0.0001. See the complete unedited blots in the supplemental material.

