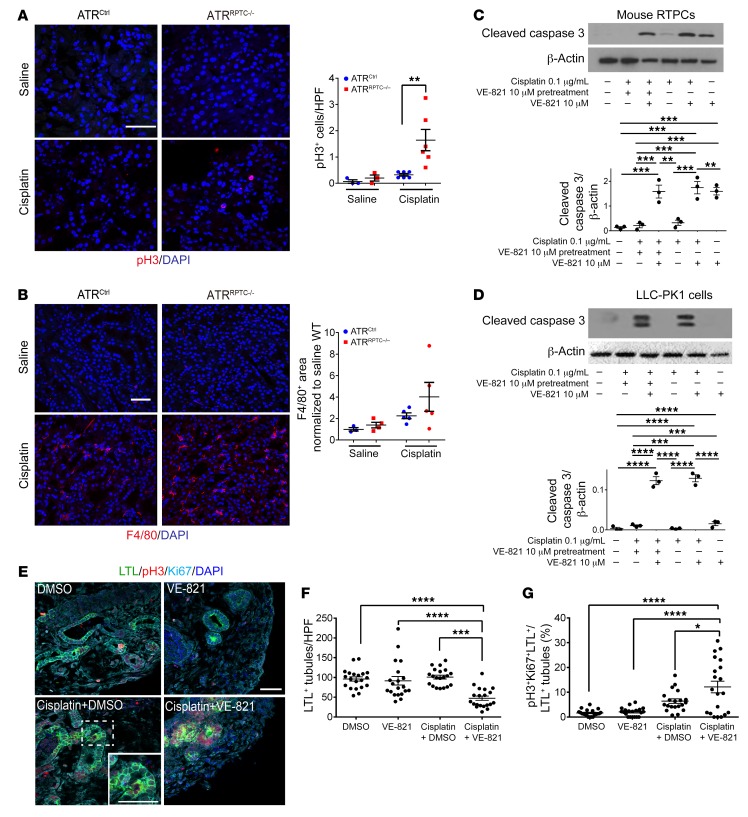
Figure 4. Atr gene deletion in RPTCs leads to increased cleaved caspase 3 and G2/M-phase cells after cisplatin injection.
(A) Representative images of pH3-stained kidney sections from ATRCtrl and ATRRPTC–/– mice 96 hours after saline or cisplatin injection and the corresponding quantification of pH3+ nuclei. Scale bar: 50 μm. Saline: ATRCtrl (n = 3), ATRRPTC–/– (n = 4); cisplatin: ATRCtrl (n = 6), ATRRPTC–/– (n = 6). (B) Representative images of F4/80-stained kidney sections from ATRCtrl and ATRRPTC–/– mice 96 hours after saline or cisplatin injection. Scale bar: 50 μm. Dot plot shows corresponding quantification of F4/80+ area. Saline: ATRCtrl (n = 3), ATRRPTC–/– (n = 4); cisplatin: ATRCtrl (n = 5), ATRRPTC–/– (n = 5). Representative Western blots of cleaved caspase 3 expression in mouse RPTCs (C) and LLC-PK1 cells (D) treated with cisplatin, VE-821, or a combination of both. n = 3 independent experiments. (E) Representative images of H9 cell–derived day-64 organoids treated with either cisplatin (5 μM) or vehicle (DMSO) for 24 hours, with or without 10 μM VE-821 pretreatment. Sections of the organoids were stained for LTL, pH3, Ki67, and DAPI. Scale bar: 50 μm; inset shows a high-power magnification of a triple-positive tubule. (F) Quantitation of LTL+ tubules and (G) percentage of pH3+, Ki67+, and LTL+ cells to LTL+ cells (n = 2 ×10 high-power fields [HPF] in each treatment group). Data are presented as the mean ± SEM. Statistical significance was determined by 2-tailed, unpaired t test (A and B, cisplatin ATRCtrl vs. cisplatin ATRRPTC–/–) and 1-way ANOVA followed by Tukey’s post-hoc test (C, D, F, and G) *P < 0.05, **P < 0.01, ***P < 0.001, and ****P < 0.0001.

