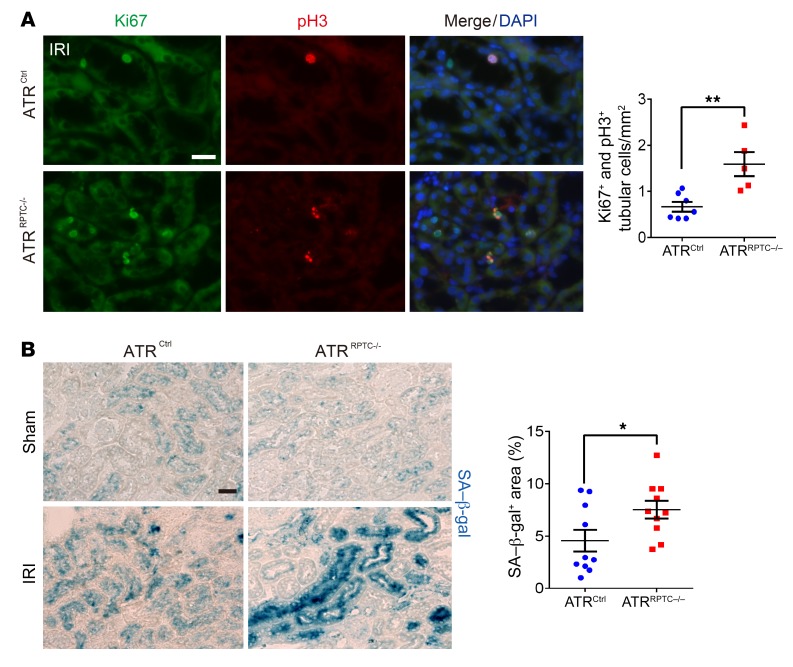
Figure 7. Atr gene depletion in RPTECs results in G2/M arrest and cellular senescence after IRI.
(A) Representative images of coimmunostaining with antibodies against Ki67 and pH3 in cells from ATRCtrl and ATRRPTC–/– mice on day 28 following IRI and the corresponding quantification of Ki67+ and pH3+ nuclei. ATRCtrl (n = 7), ATRRPTC–/– (n = 5). Scale bar: 50 μm. (B) Representative images of SA–β-gal–stained kidney sections from ATRCtrl and ATRRPTC–/– mice 28 days after IRI or sham operation. Scale bar: 50 μm. Dot plots shows the quantification of SA–β-gal+ areas. IRI: ATRCtrl and ATRRPTC–/– mice (n = 5 mice and 10 kidneys). Data are presented as the mean ± SEM. Statistical significance was determined by 2-tailed, unpaired t test (IRI ATRCtrl vs. IRI ATRRPTC–/–). *P < 0.05 and **P < 0.01.

