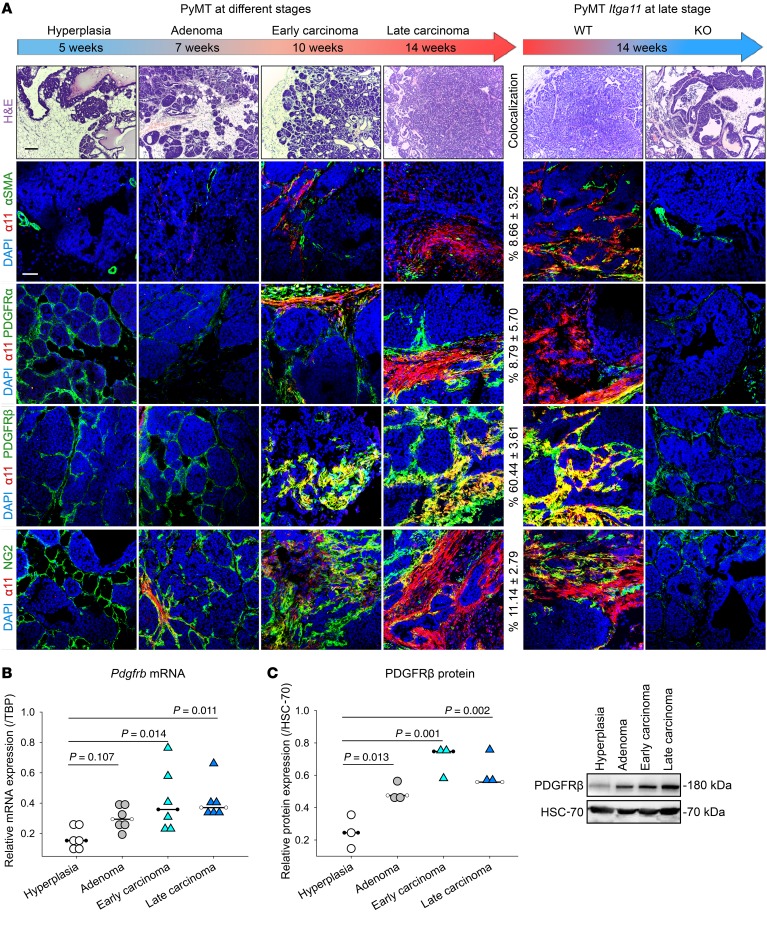
Figure 3. Integrin α11 defines a PDGFRβ+ CAF subpopulation, and its expression is increased during tumor progression.
(A) Representative pictures of H&E and immunofluorescence staining of PyMT mice at different stages (left panel) and PyMT Itga11-WT and -KO mice at late stage (14 weeks) (right panel). Immunofluorescence confocal pictures show the costaining of integrin α11 (red) and αSMA, PDGFRα, or PDGFRβ (green). Nuclei stained with DAPI (blue). Scale bars: 50 μm. The percentages of cells positive for integrin α11 and a second marker compared with the total number of α11+ cells are indicated (“Colocalization”). Colocalization was determined by a computerized method on more than 12 stromal fields per tumor (n = 8 for each genotype). (B and C) Quantification of Pdgfrb mRNA levels (quantitative reverse transcriptase PCR, data normalized to TBP) (n = 6) (B) and protein levels (Western blot, data normalized to HSC-70) (n = 3) (C) in PyMT tumors. Representative pictures of Western blots are shown in the right panel. One-way ANOVA with Holm-Šidák multiple-comparisons test.

