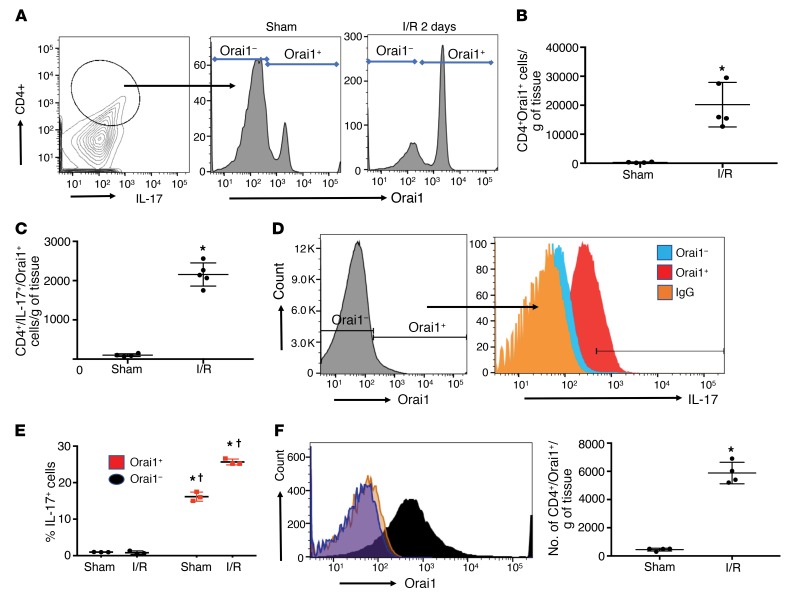
Figure 1. Coexpression of Orai1 and IL-17 in CD4+ T cells following renal I/R.
(A) Contour plot of renal lymphocytes stained with antibodies for CD4 and IL-17 to identify Th17 cells (left). Orai1 staining in gated Th17 cells of sham (middle) and 2 days after I/R (right). (B) The number of Orai1+/CD4+ cells in sham and post-I/R rat kidneys. (C) The number of Orai1+/CD4+/IL-17+ cells in sham and post-I/R rat kidneys. (D) Representative histogram of Orai1+ cells in kidney CD4+ fraction (left) 2 days after I/R, and the distribution of IL-17 expression as a function of Oria1 (right). (E) The percentage of IL-17+ cells as a function of Orai1 expression in CD4+ cells following sham surgery or 2 days after I/R. (F) Sustained expression of Orai1 in CD4+ cells following 7 days of recovery from I/R surgery is shown as a representative histogram (left); total number of Orai1+/CD4 cells (right). In B, C, E, and F, data are mean ± SE of 4–5 rats per group. *P < 0.05 for sham versus post-AKI by Student’s t test (B, C, F) and for sham versus I/R (E); †P < 0.05 in Orai1– versus Orai1+ cells, by 1-way ANOVA and Tukey’s post hoc test.

