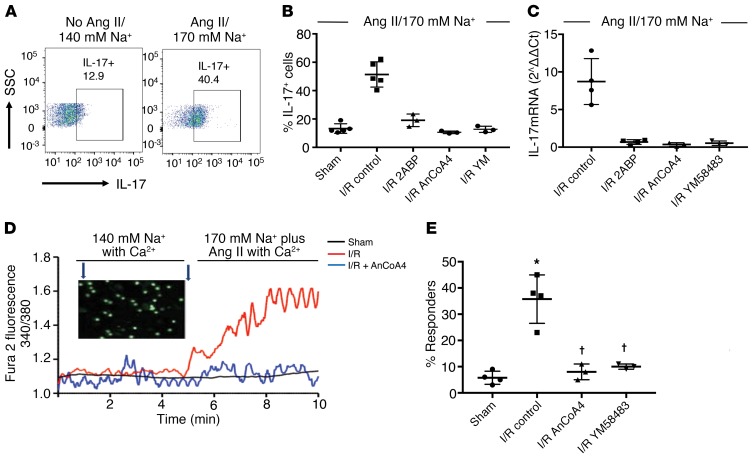
Figure 2. Orai1 activity contributes to IL-17 expression in CD4+ lymphocytes primed by renal ischemia/reperfusion injury.
(A) Representative FACS showing increased IL-17 expression in CD4+ cells from 7-day post-AKI rats following stimulation in vitro with 170 mM Na+ and Ang II versus control media. (B) Percentage of IL-17+ cells in CD4+ cells isolated 7 days after sham or AKI and stimulated in vitro. (C) IL-17 mRNA, expressed as 2–ΔΔCT of kidney-derived CD4+ cells, isolated 7 days after I/R surgery and stimulated in vitro. In B and C, control refers to AKI-primed CD4+ cells stimulated with 170 mM Na+ and Ang II (10–7 M), and SOCE inhibitors are included as labeled. (D) Fura-2 fluorescence imaging of intracellular Ca2+ in CD4+ lymphocytes in response to increased Na+ (170 mM) plus Ang II (10–7 M), as indicated in the timeline and expressed as the ratio of fluorescence using 340/380 nm excitation. Shown are representative tracings of CD4+ cells from kidney following sham surgery (black) or I/R injury (red), or from I/R injury with coincubation with AnCoA4 (blue). The inset illustrates representative visual field of multiple fura-2–loaded cells. (E) Percentage of cells manifesting an increase in Ca2+ response relative to baseline following in vitro stimulation with increased Na/Ang II. Data are mean ± SE from 4–5 rats per group per assay; *P < 0.05 versus unstimulated cells (i.e., no Ang II and normal Na, data not shown, see Supplemental Figure 3); †P < 0.05 inhibitors versus stimulated post-AKI cells by 1-way ANOVA and Tukey’s post hoc test.

