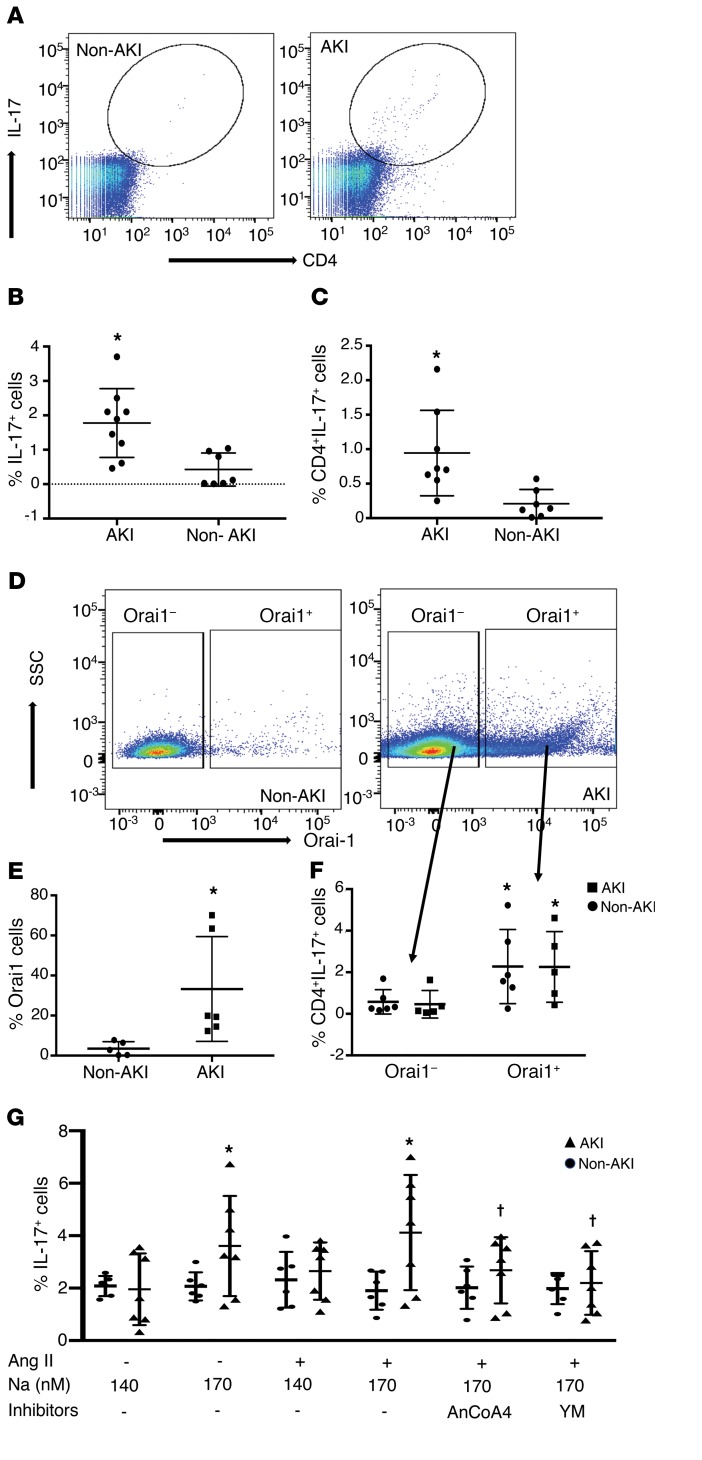
Figure 5. Elevated Th17 and Orai1 expression and effect of SOCE on IL-17 responses in CD4+ blood lymphocytes in critically ill patients with or without AKI.
(A) Representative FACS analysis of total peripheral blood cells in non-AKI (left, n = 8) vs AKI patients (right, n = 9) demonstrating the increase in CD4+ IL-17+–expressing cells. Quantification of the percentages of total IL-17+ cells (B) and CD4+/IL-17+ cells (C) in AKI versus non-AKI patients are shown. Representative dot plots showing (D) an increase in Orai-1+ cells in AKI patients as compared with non-AKI patients and (E) the percentage of Orai-1+ cells in AKI vs non-AKI patients. (F) Percentage of CD4+/IL-17+ cells gated on Orai1+ and Orai1– fractions (arrows). (G) IL-17 response to stimulation with elevated sodium (170 mM) and Ang II is shown for CD4+ cells isolated from AKI (n = 5) or non-AKI (n = 5) patients. Data are expressed as mean ± SE. *P < 0.05 by Student’s t test in AKI versus non-AKI patients (B–D), in Orai1+ versus Orai1– cells (F), or versus unstimulated (i.e., 140 mM and no Ang II) (G). †P < 0.05 inhibitors versus stimulated using 1-way ANOVA and Tukey’s post hoc test.

