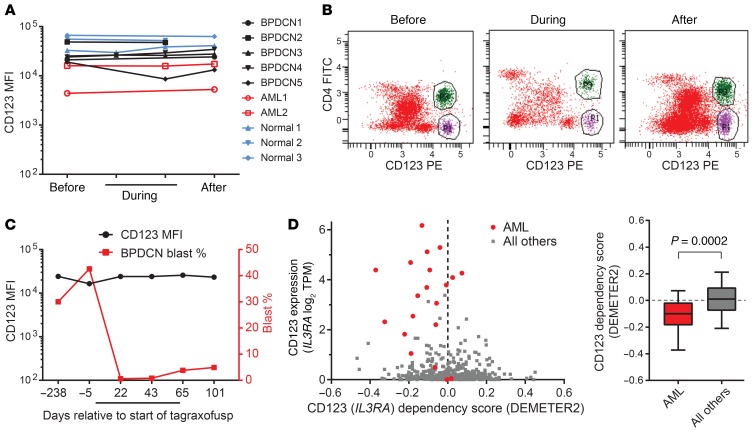
Figure 1. CD123 expression is maintained during and after tagraxofusp treatment in patients.
(A) The mean fluorescence intensity (MFI) of CD123 staining as measured by flow cytometry in bone marrow aspirates is plotted before, during, and after tagraxofusp treatment and annotated as malignant blasts of AML or BPDCN, or as putative non-blast CD123-positive cells. (B) An illustrative example of bone marrow aspirate flow cytometry from a patient with BPDCN before, during, and after tagraxofusp showing the malignant CD4+CD123+ BPDCN blasts (green) and the CD4–CD123+ non-blast cells (purple). (C) CD123 MFI and relative BPDCN blast percentage in bone marrow are plotted from another illustrative patient before, during (black bar), and after tagraxofusp treatment, showing maintenance of CD123 at a stable level despite significant changes in the relative percentage of blasts. These examples are representative of all cases in A, wherein the CD123 level was unchanged regardless of whether there was a significant change in disease burden. (D) CD123 (IL3RA) dependency score (x axis) is plotted against CD123 (IL3RA) RNA expression level in transcripts per million (TPM) for cell lines in Project Achilles. AML cell lines are labeled red (n = 20) and others are gray (n = 481). Negative dependency scores (calculated using DEMETER2) signify that cell line has a relative growth disadvantage when CD123/IL3RA is depleted in a genome-wide pooled shRNA assay. P value calculated using 2-tailed t test.

