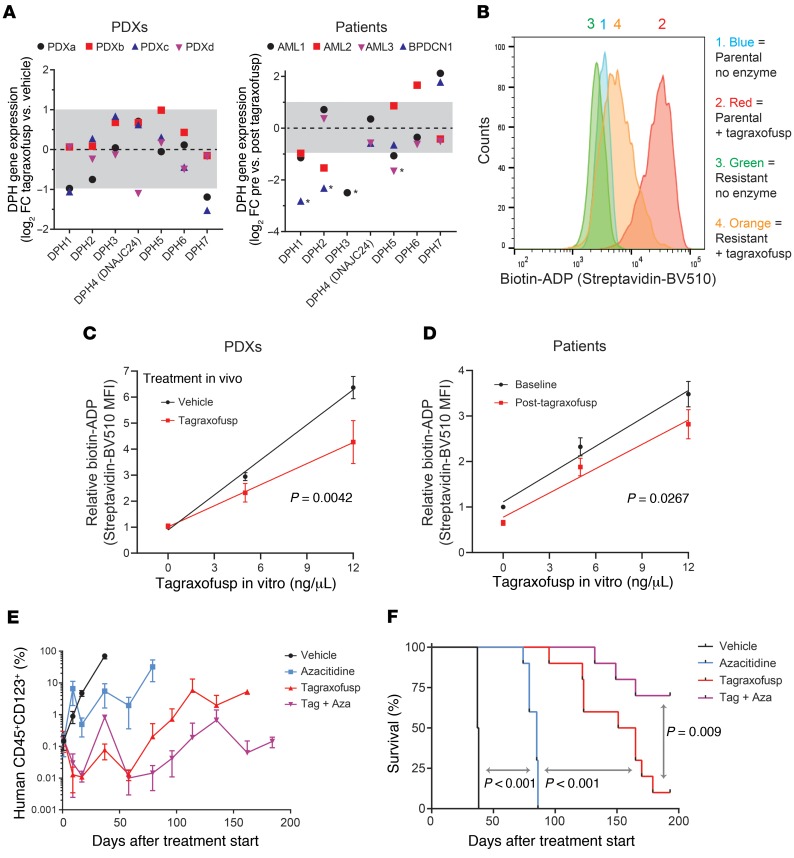
Figure 6. Impaired ADP-ribosylation activity in resistant cells and effectiveness of tagraxofusp plus azacitidine in vivo.
(A) Log2(fold change) (log2FC) in RNA expression for diphthamide genes in individual PDXs (left) and patients (right) after exposure to tagraxofusp in vivo compared to vehicle (PDXs) or baseline (patients). Dotted line represents no change (log2FC = 0) and gray area is less than 2-fold change in expression (log2FC –1 to 1). *Genes below 0.1 fragments per kilobase of transcript per million mapped reads (FPKM) after tagraxofusp, in which case an FPKM of 0.1 was used to calculate fold change. Genes that had FPKM less than 0.1 before treatment are not shown. (B) Flow cytometry–based in vitro enzymatic labeling assay for tagraxofusp-induced ADP-ribosylation activity in parental and tagraxofusp-resistant CAL1 cells, showing decreased labeling with biotin-NAD+ in the setting of tagraxofusp resistance. Staining detected with streptavidin-BV510 fluorescence. (C) Flow cytometry–based enzymatic labeling assay with increasing doses of tagraxofusp measuring ADP-ribosylation activity as in panel B for BPDCN PDXs harvested from spleen or bone marrow at the time of disease progression after in vivo treatment with vehicle (n = 8) or tagraxofusp (n = 10). Curves compared by regression modeling of least-squares fit. (D) Flow cytometry–based ADP-ribosylation activity over increasing concentrations of tagraxofusp added in vitro measured in single CD45+CD123+ cells collected from the bone marrow of 5 patients before and after in vivo treatment with tagraxofusp (curves compared as in panel D). (E) Disease burden measured by peripheral blood human CD45+CD123+ flow cytometry in animals engrafted with BPDCN PDX cells after 2 cycles of treatment (at days 0 and 30) with vehicle, azacitidine, tagraxofusp, or the combination of tagraxofusp and azacitidine (Tag + Aza). (F) Kaplan-Meier overall survival curves from the time of treatment start for animals after treatments described in panel E (n = 10 mice per arm for panels E and F). Curves compared pairwise by log-rank test.

