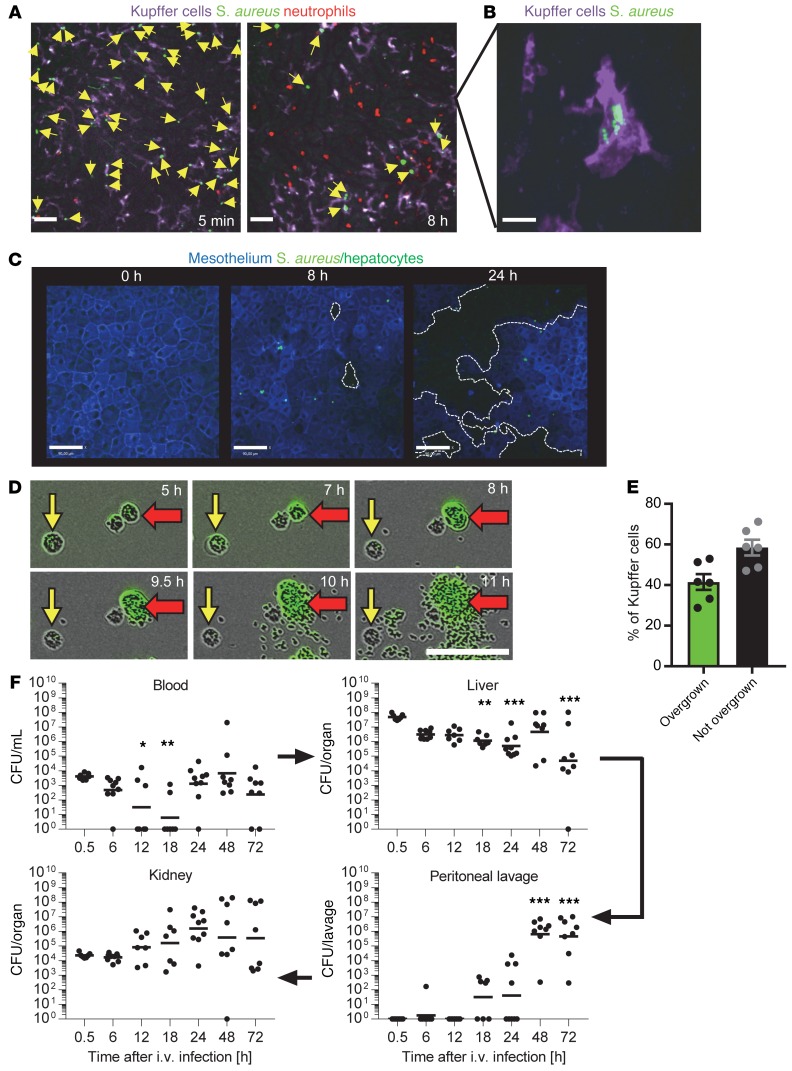
Figure 1. S.aureus escapes from liver Kupffer cells and grows into the peritoneal cavity.
(A) SD-IVM images of GFP S. aureus (green) catching by Kupffer cells (F4/80; purple) 5 minutes (left; see also Supplemental Video 1) or 8 hours (right) after i.v. infection. Neutrophils are labelled in red (Ly6G). Scale bars: 50 μm. (B) Enlarged view of a Kupffer cell (F4/80; purple) 8 hours after infection with growing GFP S. aureus (green) inside. Scale bar: 10 μm. (C) Representative images of SD-IVM of liver at indicated time points after i.v. infection. Mesothelium in blue (podoplanin-EF660), GFP S. aureus in bright green, and hepatocytes in dark green autofluorescence. Scale bar: 90 μm (n = 3 per time point). (D and E) Kupffer cells were isolated from mice infected with GFP S. aureus for 30 minutes, cultured, and imaged over 11 hours ex vivo. (D) Representative images of time-lapse videos (Supplemental Video 2). Scale bar is 60 µm. (E) Analysis of time-lapse videos, 4 FOV per mouse; shown is the mean ± SEM (n = 6 from 4 independent experiments). (F) Mice were infected i.v. with 5 × 10⁷ CFU S. aureus. Blood was collected, peritoneal lavage was performed, and organs were harvested at the indicated time points from which CFU were determined. Shown is the geometric mean (n = 7–9 from 3 independent experiments), Kruskal-Wallis with Dunn’s post test; *P < 0.05, **P < 0.01, and ***P < 0.001 compared with the 0.5-hour time point for each organ.

