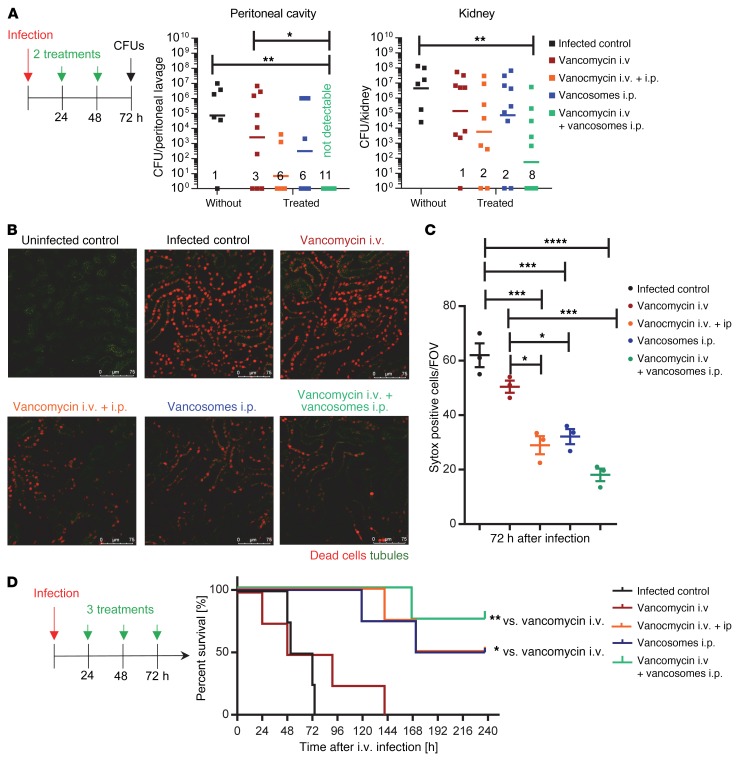
Figure 5. Intraperitoneal liposomal vancomycin (vancosomes) targets tissue resident macrophages to eradicate infections and sustain survival.
Mice were infected i.v. with 5 × 10⁷ S. aureus Newman and treated 2 (24 hours plus 48 hours, A–C) or 3 times (24 hours plus 48 hours plus 72 hours, D) with either vancomycin i.v (red), vancosomes i.p. (blue), a combination of vancomycin i.v. plus i.p. (orange), or vancomycin i.v. plus vancosomes i.p. (green). (A) Seventy-two hours after infection, organs were harvested, peritoneal lavage was performed, and CFU were determined (n = 6–11 from 3 independent experiments). Data are presented as the geometric mean; Kruskal-Wallis with Dunn’s post test; *P < 0.05 and **P < 0.01. (B) Representative 2-photon IVM images of kidneys 72 hours after infection with or without treatment 2 times. Dead tubular cells are stained with Sytox Orange (red), tubules appear in dark green autofluorescence. Scale bar: 75 μm. (C) Analysis of B. Number of Sytox Orange+ (dead) cells from 8 FOV per mouse, data represent the mean ± SEM (n = 3, 1-way ANOVA with Bonferroni’s multiple comparisons test). *P < 0.05, ***P < 0.001, and ****P < 0.0001. (D) Survival curve of S. aureus-infected and treated mice (n = 4 mice per group from 2 independent experiments). Log-rank test compared with vancomycin i.v., *P < 0.05 and **P < 0.01.

