
Figure 12.
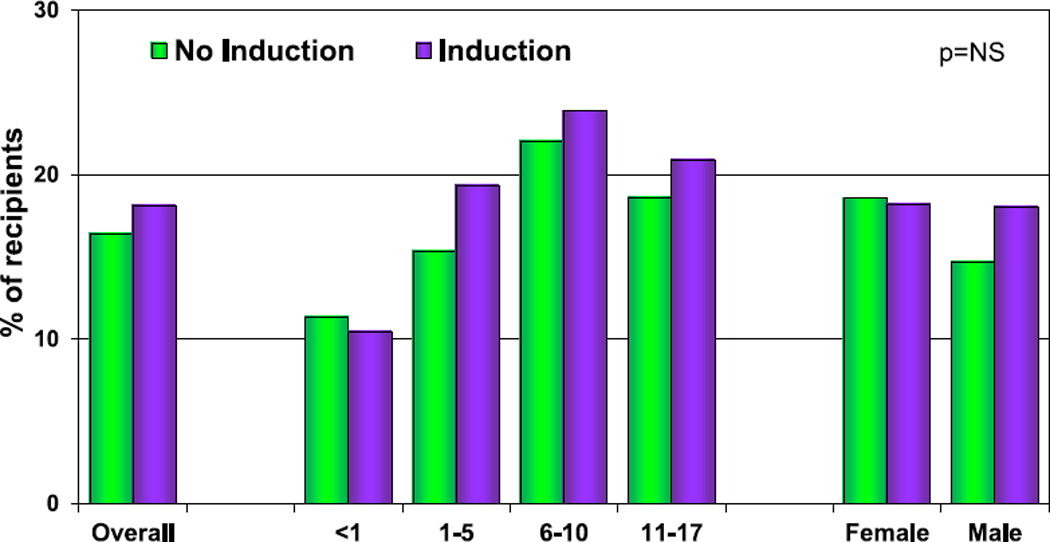
Percentage of recipients experiencing treated rejection between discharge and 1-year follow-up by use of induction therapy (follow-ups: January 2005–June 2018). NS, not significant.
Official websites use .gov
A
.gov website belongs to an official
government organization in the United States.
Secure .gov websites use HTTPS
A lock (
) or https:// means you've safely
connected to the .gov website. Share sensitive
information only on official, secure websites.
Percentage of recipients experiencing treated rejection between discharge and 1-year follow-up by use of induction therapy (follow-ups: January 2005–June 2018). NS, not significant.