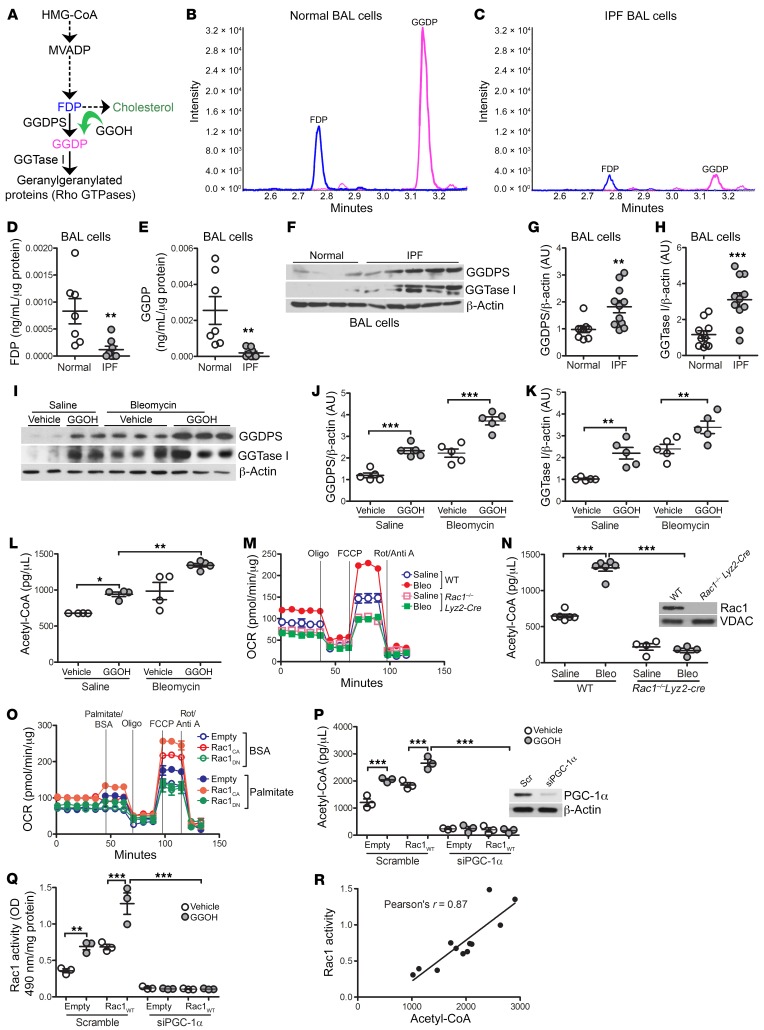
Figure 5. IPF BAL cells have reduced GGDP levels.
(A) Schematic diagram of the mevalonate pathway. Representative mass spectrometric chromatography of FDP and GGDP in (B) normal (n = 7) and (C) IPF (n = 8) BAL cells. Levels of (D) FDP and (E) GGDP in BAL cells from healthy subjects (n = 7) and patients with IPF (n = 8) determined by mass spectrometry. (F) Representative immunoblot analysis of BAL cells from healthy subjects (n = 4) and patients with IPF (n = 5). Quantification of immunoblot in F of expression of (G) GGDPS and (H) GGTase 1 in BAL cells from healthy subjects (n = 9–11) and patients with IPF (n = 11). (I) Representative immunoblot analysis of MDMs from WT mice s.c. treated with vehicle or GGOH 10 days after exposure to saline or bleomycin (n = 5/group). Quantification of (J) GGDPS and (K) GGTase 1 expression in I (n = 5/group). (L) Acetyl-CoA concentration (n = 4–5). (M) OCR and (N) acetyl-CoA concentration in BAL cells isolated from WT or Rac1–/– Lyz2-Cre mice exposed to saline or bleomycin for 21 days (n = 5 mice/group). Inset in N shows Rac1 immunoblot analysis. (O) OCR in transfected MH-S cells (n = 3–4). FCCP, ; Oligo, oligomycin; FCCP, Carbonyl cyanide 4-(trifluoromethoxy)phenylhydrazone; Rot/Anti A, rotenone/antimycin A. (P) Acetyl-CoA concentration and (Q) Rac1 activity in THP-1 cells expressing scrambled siRNA or siPGC-1α together with empty or Rac1WT and treated with GGOH (n = 3/group). Inset in P shows PGC-1α immunoblot analysis. (R) Pearson’s correlation of acetyl-CoA to Rac1 activity. Values indicate the mean ± SEM. *P < 0.05, **P < 0.001, and ***P < 0.0001, by 2-tailed Student’s t test statistical analysis (D, E, G, and H), 1-way ANOVA followed by Tukey’s multiple comparisons test (J–L, N, P, and Q), and Pearson’s correlation analysis (R).

