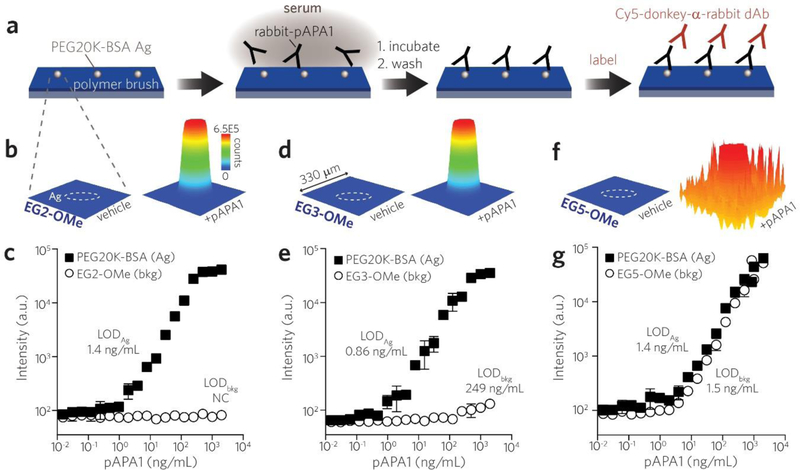
Figure 4 |.
Direct comparison of reactivity of APAs toward POEGMA brushes with different EG sidechain lengths versus linear PEG (MW = 20 K). a, Schematic of printing microspots of PEG20K-BSA Ag onto a background of POEGMA brush surfaces. Surfaces were incubated with a dilution series of rabbit-derived pAPA1 in serum, labeled with Cy5-anti-rabbit dAb, and then read by a fluorescence scanner. b, Spatial intensity plots of Cy5 fluorescence from EG2-OMe polymer brush surfaces functionalized by PEG20K-BSA Ag microspots (outlined by white dashes). Shown are 330 × 330 μm regions corresponding to surfaces (containing a single Ag microspot) exposed to serum alone (left) versus serum spiked with 2 μg/mL pAPA1 (right). c, Concentration curves of pAPA1 binding measured by fluorescence intensity from PEG20K-BSA Ag microspots (black squares) versus that from EG2-OMe POEGMA background (open circles). Similar spatial intensity plots and concentration curves as shown for EG2-OMe in (b, c) are shown for EG3-OMe in (d, e) and EG5-OMe in (f, g). Data plotted in (c, e, g) represent mean ± s.d. (n = 3). LODs determined from PEG20K-BSA microspots versus polymer background (LODAg vs. LODbkg, respectively) are displayed adjacent to each curve.

