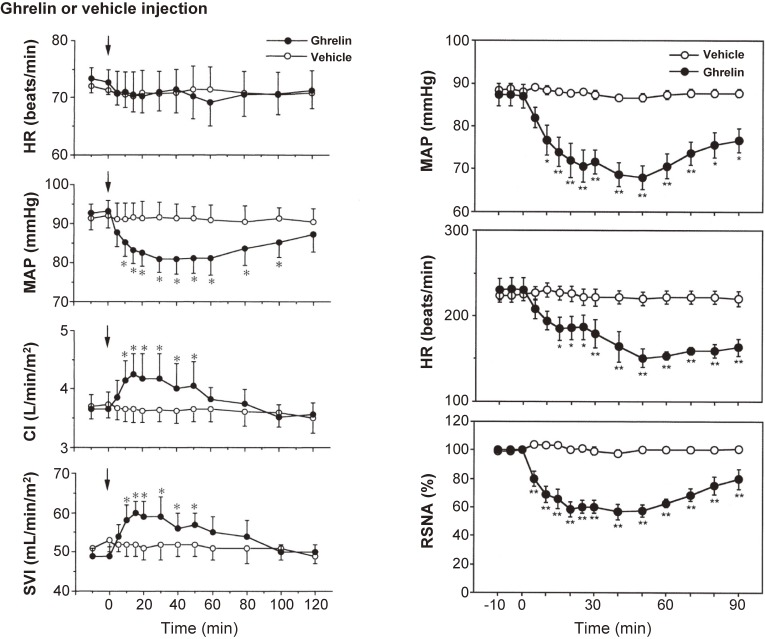
Figure 3.
Left panel: Effect of ghrelin on the heart rate (HR), mean arterial pressure (MAP), cardiac index (CI), and stroke volume index (SVI). Data are means ± SE. *P < 0.05 vs. vehicle group. Adapted from Nagaya et al.16) Right panel: Time course of MAP, HR, and renal sympathetic nerve activity (RSNA) elicited by intracerebroventricular injection of 1 nmol of ghrelin or vehicle (n = 6 for each). Values are mean ± SE. *P < 0.05, **P < 0.01 vs. control period. Adapted from Matsumura et al.18)

