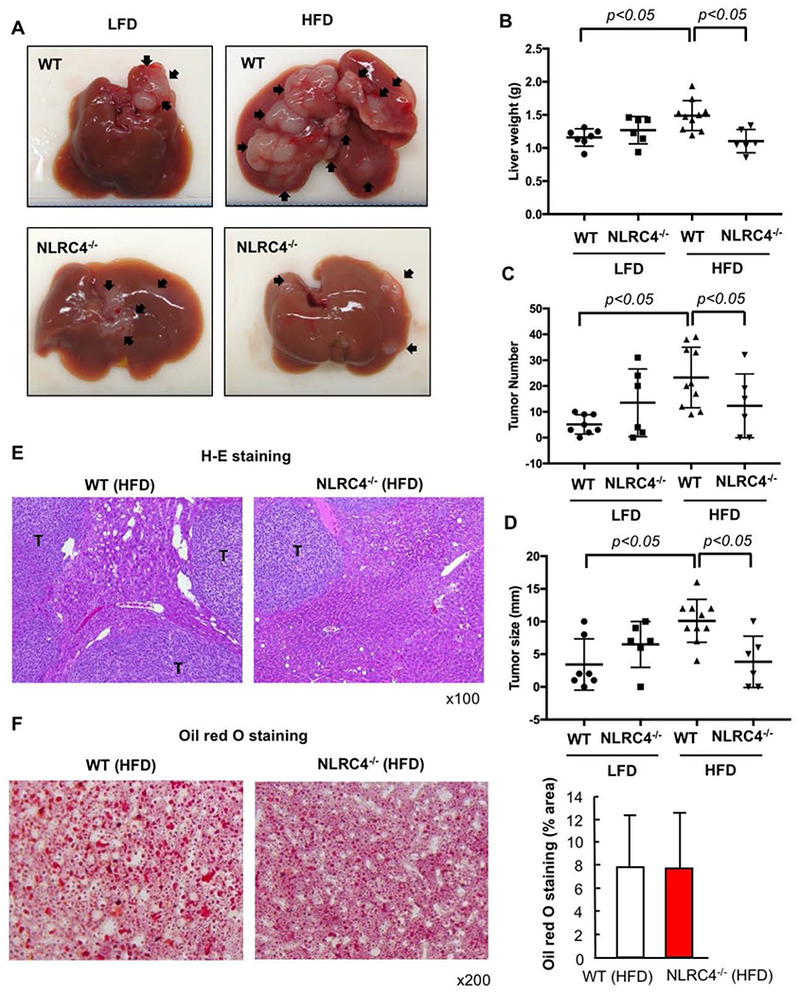
FIGURE 4. Metastatic liver tumor growth enhanced by NAFLD is suppressed by NLRC4 deficiency.

WT and NLRC4−/− mice were injected via the spleen with MC38 colorectal cancer (CRC) cells after 6 weeks of being fed low-fat diet (LFD) or high-fat diet (HFD) which was continued for an additional 2 weeks. (A) Macroscopic appearance of the liver. Arrow, tumors. (B) Liver weight. (C) Number of visible liver tumors. (D) Maximal size of tumors. (E) H&E staining. T, tumor. (F) Oil red O staining and its quantification. n=6–10, each group. Representative pictures are shown. Data are shown as mean ± S.D.
