Figure 3:
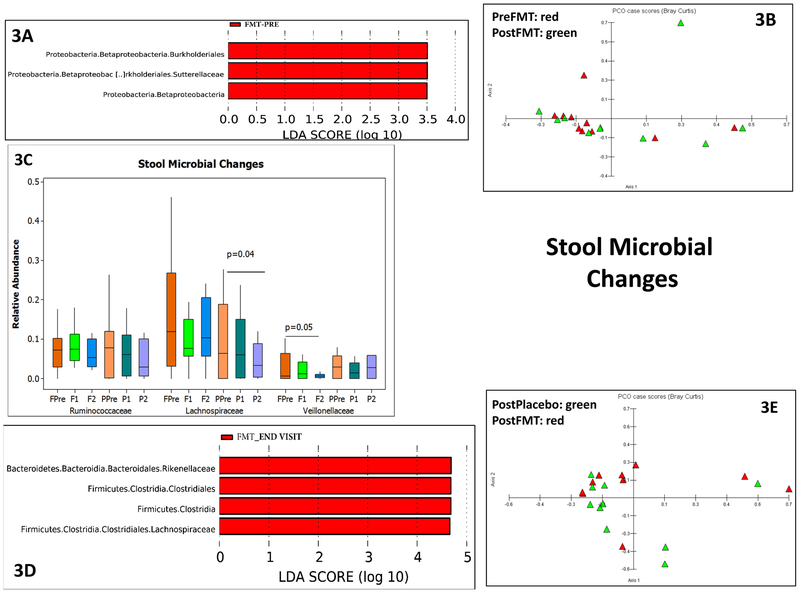
3A: LEFSe in pre vs post FMT (red bars) in stool microbiota within the FMT group
3B: PCA shows relative clustering of pre-FMT (red) compared to the post-FMT stool microbiota (green)
3C: Median and 95% CI of selected taxa pre (orange) and post (green) FMT in stool microbiota. FPre: FMT group pre-FMT, F1: first post-FMT visit in FMT group, F2: end of study visit FMT group, PPre: Placebo group baseline, P1: first post-placebo visit, P2: end of study visit placebo group. P values based on Kruskal-Wallis tests showed reduction in Lachnospiraceae over time in placebo group and reduction of Veillonellaceae over time in the FMT group.
3D: LEFSe of end study visit in placebo vs FMT group at end of study visit showed a relatively higher abundance of Lachnospiraceae in the FMT compared to placebo group on the stool.
3E: PCA shows relative clustering of post-FMT away from post-placebo in stool microbiota
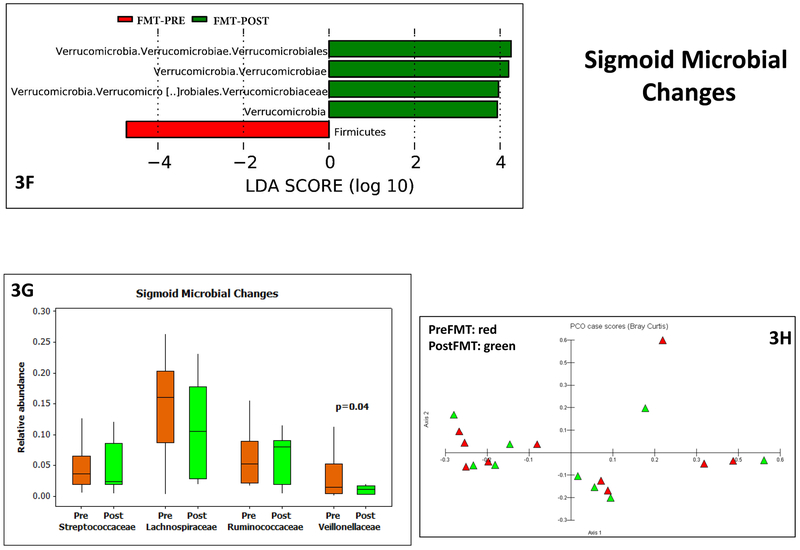
3F: LEFSe results pre (red bars) and post (green bars) FMT in sigmoid mucosal microbiota
3G: Median and 95% CI of selected taxa pre (orange) and post (green) FMT in sigmoid mucosal microbiota showed a lower Veillonellaceae post-FMT compared to baseline. P values based on Wilcoxon signed rank pairs test.
3H: PCA shows little separation between pre (red) and post-FMT (green) sigmoid microbiota


