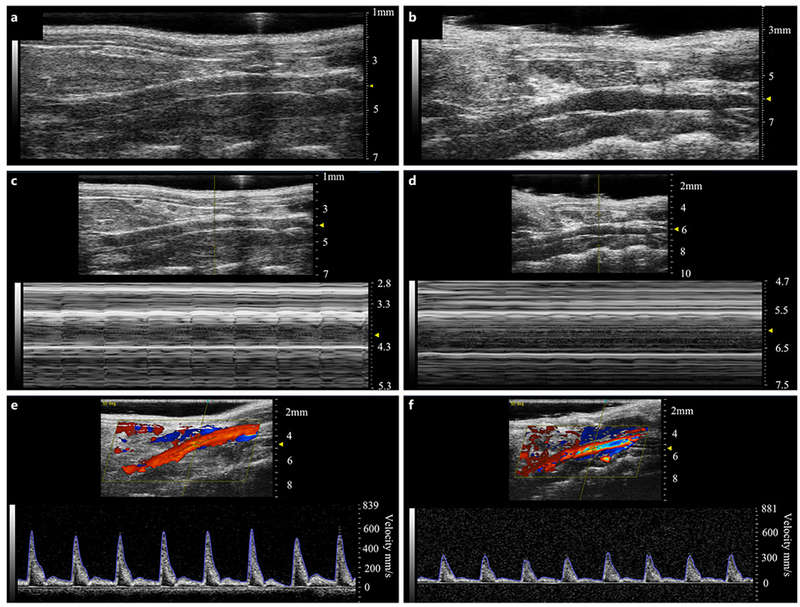
Fig. 1.

Representative healthy (left panels) and aneurysmal (right panels) murine aortae with B-mode (a, b), M-mode (c, d), and PWD (e, f) images. B-mode images were used to assess overall vessel structure and quantify the increase in aortic diameter after PPE treatment. M-mode was used to measure circumferential cyclic strain, and PWD was used to quantify mean and peak velocities.
