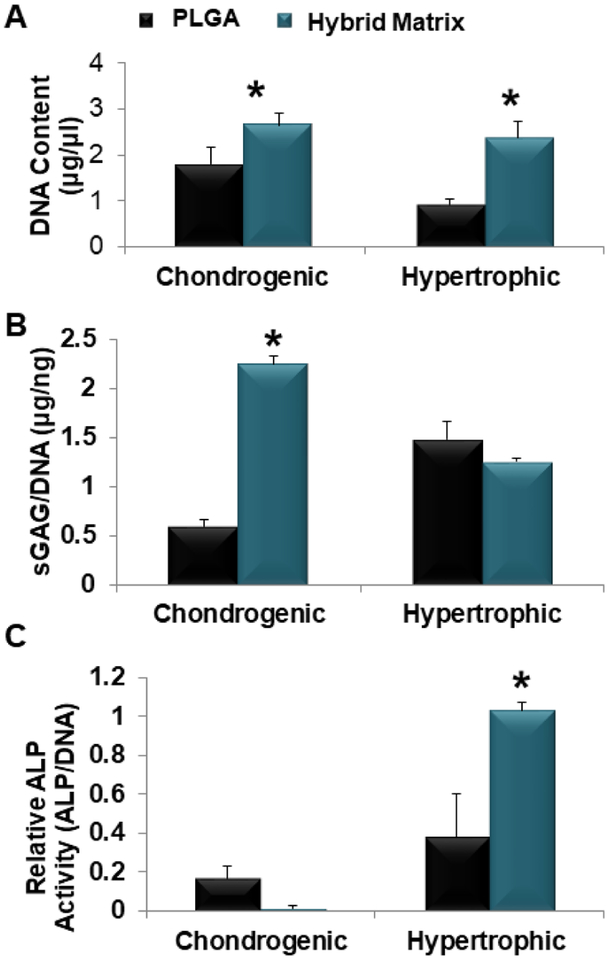
Figure 3.
MSC chondrogenesis and hypertrophy. hBMSCs seeded within PLGA and hybrid matrix and cultured in chondrogenic media for two weeks for analysis or followed by an additional two week culture in hypertrophic media (A) hBMSCs proliferation in PLGA and hybrid matrix during the hypertrophic-cartilage template formation. Results of Picogreen assay showing DNA content of hBMSCs cultured in hybrid matrix was significantly higher than PLGA at both time points. (B) Quantitative analysis of sGAG formation. Dimethyl methylene blue (DMMB) assay was used to quantify glycosaminoglycan production and results are normalized to DNA content (Picogreen) (n=3, p<0.05). (C) Quantitative analysis of ALP activity. ALP activity levels and results are normalized to DNA content (Picogreen). (n=3, p<0.05).

