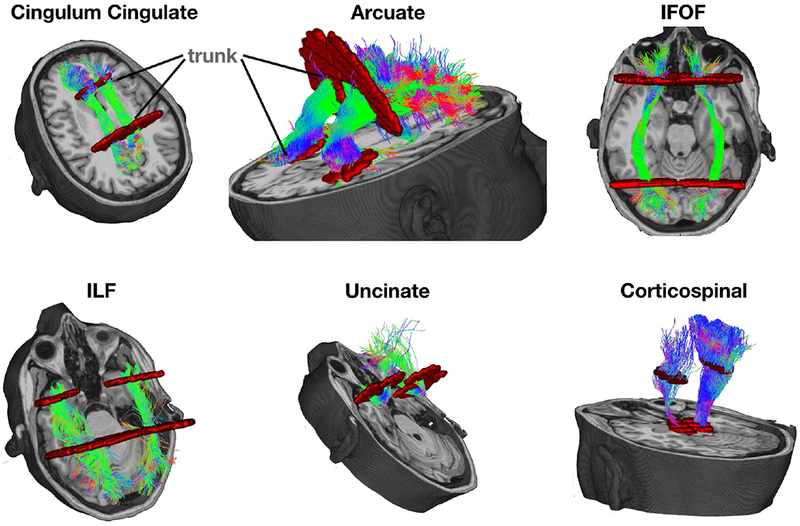
Figure 2. Six pairs of homologous tracts and their defining ROIs.

The streamlines serve as a model of white matter tracts; they are selected by fitting to the diffusion weighted imaging (DWI) measurements. The tracts are defined by regions of interest (ROIs, red) that select specific streamlines from the whole brain tractogram. The region between the two ROIs is relatively stable and called the trunk. We estimate a core fiber from the collection of streamlines and sample 100 equally spaced segments. The FA of the core fiber is calculated by combining FA transverse to the core fiber at every sample point, using a Gaussian weighting scheme over distance. The set of sample points is the tract profile; the average of the FA values of the core fiber is the mean tract FA.
