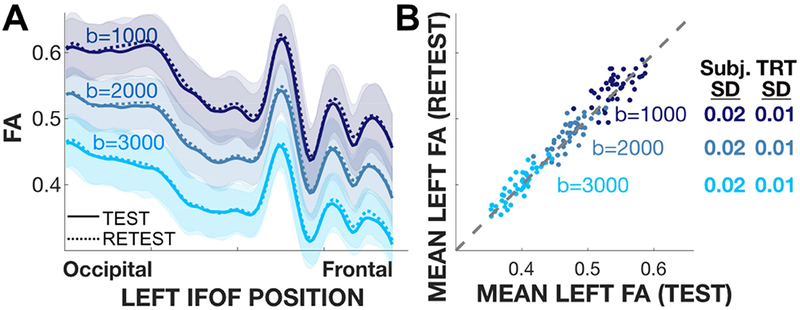
Figure 3. Replication analyses of the tract profile and mean tract FA.

Analyses are shown for a representative tract (left IFOF), and based on the HCP test-retest data. A) Tract profiles of the subject average FA in the test (solid) and retest (dashed) experiments. The mean profile (thin line) and ±1 SD (shaded band) are shown. The profiles at each b-value match very closely; across b-values the profiles have a similar shape but different absolute values. B) Test-retest scatter plot. For all b-values, the SD of the difference between the test-retest pairs of FA values is 0.01 (TRT SD), and the SD of the distribution of FA values is 0.02 (Subj. SD). (Tract profiles and scatter plots for 11 other tracts are similar and reported in Figures S1a, S2).
