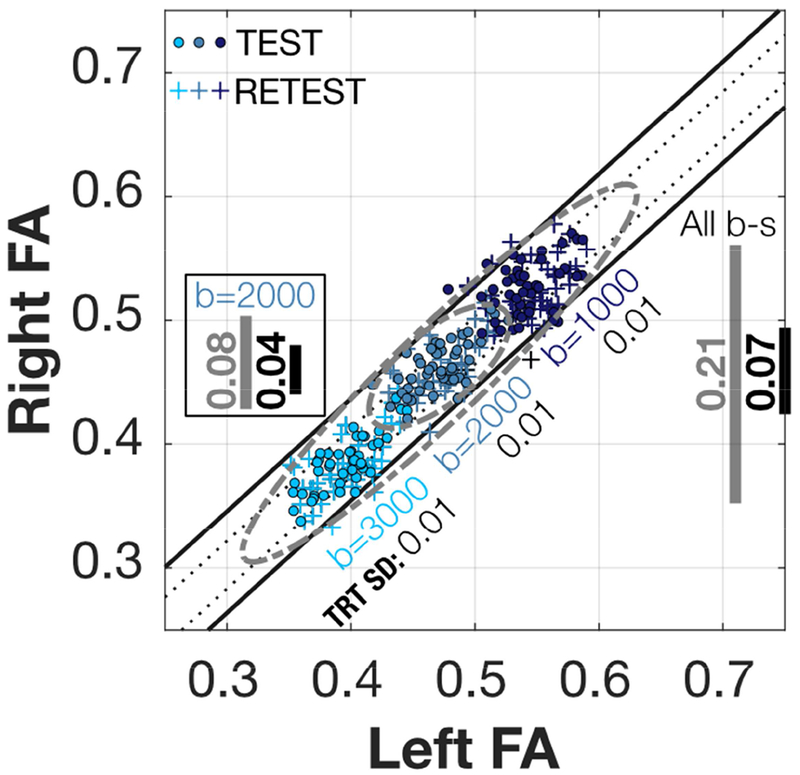
Figure 6. Left-Right IFOF FA scatterplots and iso-residual contour lines for HCP.

Scatterplot of the Left-Right IFOF HCP mean FA values. Inside the square, the grey line (0.08) shows the 95% range of all Right FA values for b=2000, and the black line (0.04) shows the range of possible values for any given Left FA value. Although not pictured, the values when using the b=2000 test-retest data points increases to 0.09 and 0.05. Outside the square to the right, the grey line (0.21) shows the 95% range of all right FA values for the combined six HCP Test-Retest values. The diagonal bands are the contour lines holding the 68% and 95% of the residuals from the linear model fitted to all the six datasets. See Figure S4a for the rest of the tracts.
