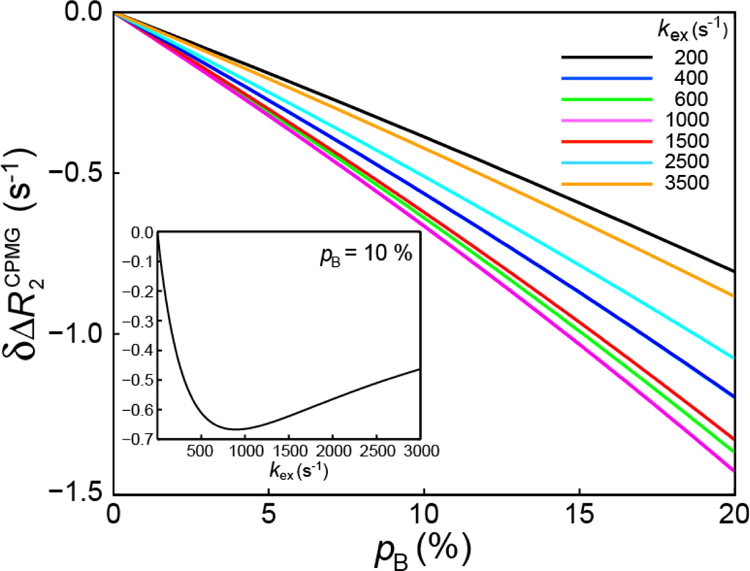
Figure 3.

Plot of as a function of the population of the minor state, pB, for exchange rates (kex) ranging from 200 to 3,500 s−1, , and Trelax = 40 ms. Eq. 17 was used for all calculations of . The curves are color-coded according to the value of kex as indicated in the plot. The inset shows a plot of as a function of kex for pB = 10 % and .
