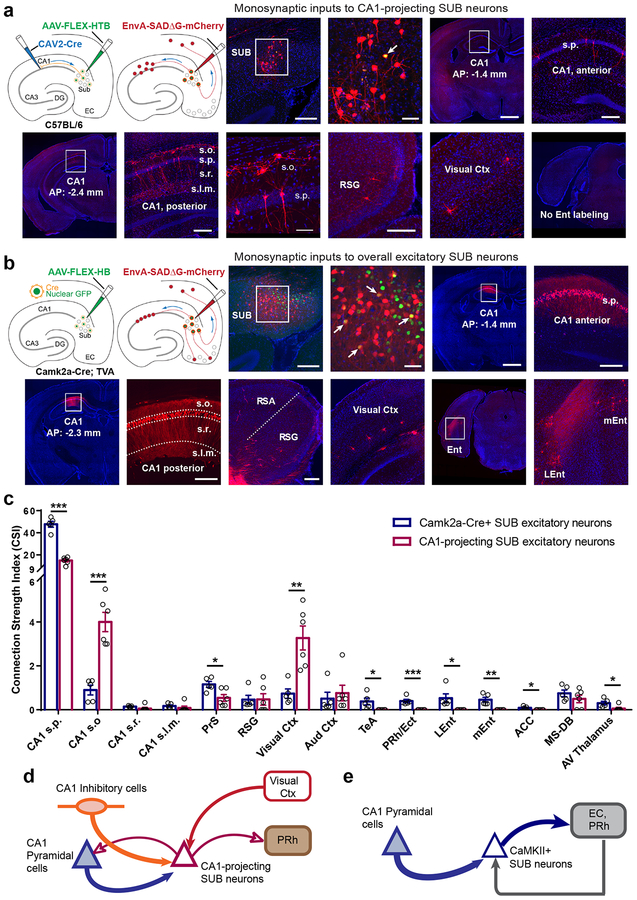
Fig. 2. CA1-projecting SUB excitatory neurons differ in circuit connections from larger populations of SUB excitatory neurons defined by Camk2a-Cre expression.
a, Global mapping of input connections to CA1-projecting SUB excitatory neurons using a combinatorial viral-genetic tracing method. The approach using CAV2-Cre and Cre-dependent monosynaptic rabies tracing is illustrated schematically (see details in Methods). The first two image panels show the injection site in the subiculum. Scale bars are 200 and 50 μm, respectively. DAPI staining is blue; rabies labeled neurons are red. The starter neuron (yellow) indicated by the white arrow appears to receive strong local SUB inputs, as it is surrounded by a cluster of other SUB neurons. Input mapped neurons in dorsal CA1, retrosplenial granular cortex (RSG), and visual cortex are shown in subsequent panels (also see Supplementary Fig. 2). CA1 projecting SUB excitatory neurons receive both excitatory and inhibitory CA1 inputs and do not receive direct input from entorhinal cortex. The scale bar (1mm) applies to low magnification image panels. The scale bar (50 μm) applies for the enlarged view of stratum oriens interneurons and pyramidal cells. All other scale bars = 200 μm. Note that all the labeled neurons shown in the figure are ipsilateral to the injection site, and very few contralateral labeled neurons were seen across all experimental cases. s.o., stratum oriens; s.p., stratum pyramidale; s.r., stratum radiatum; s.l.m., stratum lacunosum-moleculare. This experiment was independently repeated in 6 mice, each with similar results. b, Global mapping of input connections to the full population of SUB excitatory neurons using Camk2a-Cre; TVA mice. The Cre-dependent monosynaptic rabies tracing method is illustrated in the schematics on the left. The first two image panels show the injection site in the subiculum. The scale bars are 200 and 50 μm, respectively. DAPI staining is blue; rabies labeled neurons are red and starter neurons are yellow. Input mapped neurons in anterior (AP: −1.4 mm) and posterior (AP: −2.3 mm) dorsal CA1, retrosplenial granular cortex (RSG), visual cortex, and medial and lateral entorhinal cortex (mEnt and LEnt) are shown in the subsequent panels (see Supplementary Fig. 2 for more input mapped regions). The scale bar (1mm) applies to low magnification image panels. All other scale bars = 200 μm. Panels of RSG, visual cortex, and Lent/mEnt share the same scale. This experiment was independently repeated in 5 mice, each with similar results. c, Quantitative analysis of input connection strengths of CA1-projecting and Camk2a-Cre SUB excitatory neuron types, showing the connectivity strength index (CSI) for each input mapped brain structure. Data are measured from Camk2a-Cre expressing SUB excitatory neurons (N = 5 cases), and CA1-projecting SUB excitatory neurons (N = 6 cases), and are presented as mean ± SE. Two-tailed t-tests are used to test significance of differences for each input region. See detailed data in Supplementary Table 1b. *P < 0.05; **P < 0.01; ***P < 0.001. s.p., stratum pyramidale; s.o., stratum oriens; s.r., stratum radiatum; s.l.m., stratum lacunosum-moleculare. PrS: Presubiculum, RSG: Retrosplenial granular cortex, Vis Ctx: Visual cortex, Au Ctx: Auditory cortex, TeA: Temporal association cortex, PRh: Perirhinal cortex, Ect: ectorhinal cortex, Lent: Lateral entorhinal cortex; mEnt: Medial entorhinal cortex, ACC: anterior cingular cortex, MS-DB: Medial septum and diagonal band of Broca. d–e. Schematic highlights the major input connections and output projections of CA1-projecting SUB neurons versus CaMKII+ SUB excitatory neurons, based on our tracing data shown in Figs. 1 and 2 as well as incorporation of relevant literature on SUB efferent projections. Note that CA1-projecting SUB neurons are GABA immuno-negative and 90% of them are CaMKIIa positive (see Supplementary Fig. 1).

