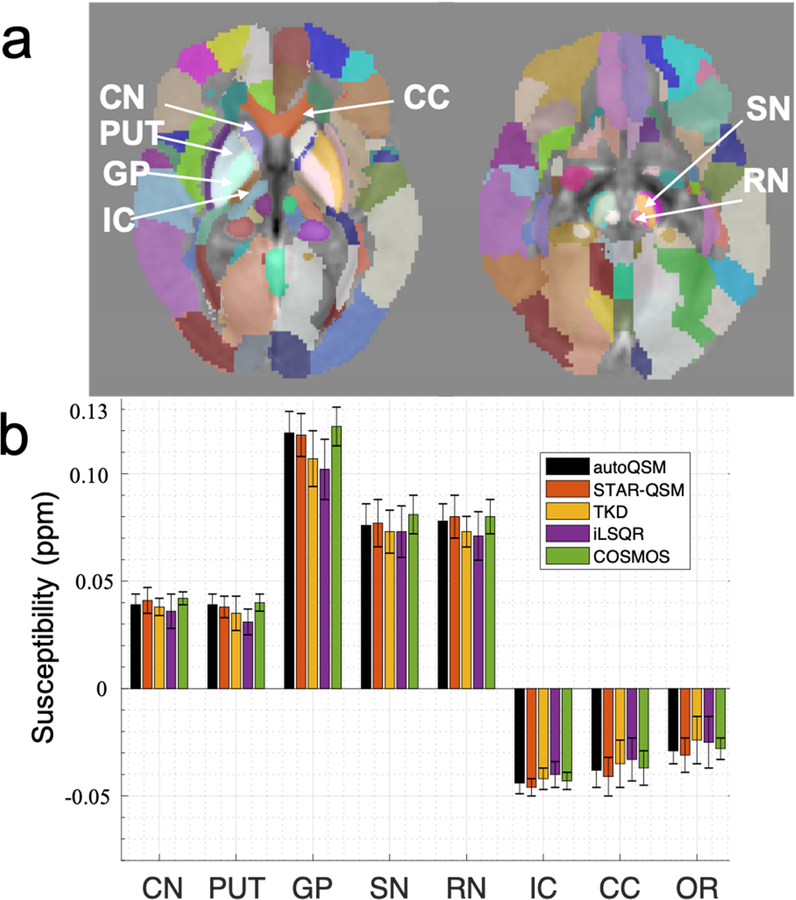
Figure 4.
ROI analysis of the five different methods. The susceptibility values of the ROIs (CN, PUT, GP, SN, RN, IC, CC, OR) are plotted, the autoQSM’s results match well with the gold-standard COSMOS QSM results. Data are presented as mean ± standard deviation. No statistically significantly difference was found in the eight ROIs within the group of subjects.

