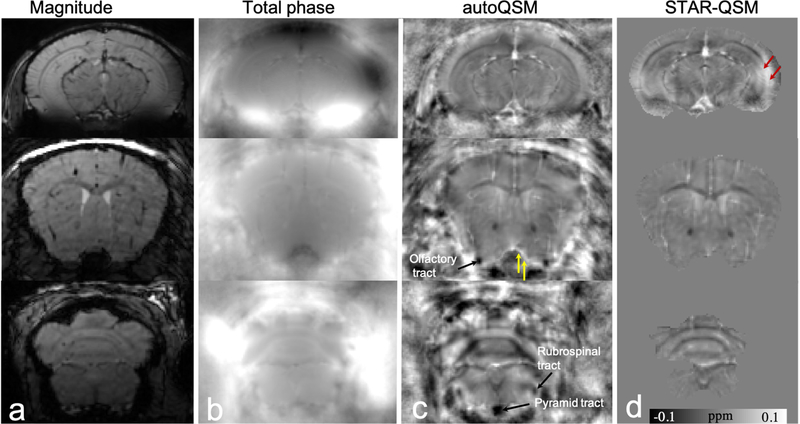
Figure 8.
Representative axial slices of QSM images computed using STAR-QSM and autoQSM methods in an in vivo mouse brain. (a) Magnitude images, (b) total phase maps, (c) QSM images predicted using trained neural network, (d) QSM image reconstructed using STAR-QSM. Red arrows point to reduced artifacts by the trained neural network. Yellow arrows point to paramagnetic susceptibility of blood vessel preserved near the cortex. Black arrows point to the recovered nerve tracts near the edges of the brain revealed by autoQSM while eroded by skull stripping.

