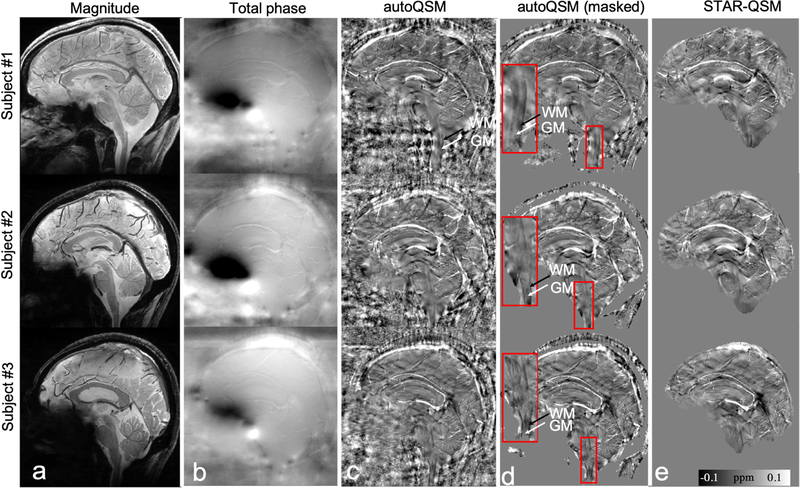
Figure 9.
Comparison of QSM reconstructed by STAR-QSM and autoQSM on three healthy volunteers scanned at sagittal view with spinal cord included at 7 T. Black and white arrows point to white matter and gray matter in zoomed-in spinal cord respectively. Note that the paramagnetic susceptibility of gray matters is surrounded by diamagnetic white matters in the spinal cord. (a) magnitude images, (b) total phase images, (c) autoQSM’s results, (d) masked autoQSM’s results by applying a masked derived from magnitude images, a zoomed-in region of spinal cord is shown for each subject as outlined by the red box, (e) STAR-QSM results.

