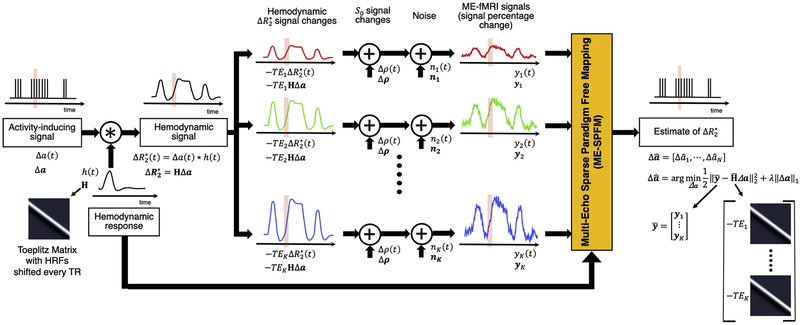
Figure 1.
Schematic of the ME-fMRI signal model and the ME-SPFM algorithm. From left to right: An activity-inducing signal (∆a(t)) is convolution with the hemodynamic response (ℎ(t)) resulting in the activity-induced hemodynamic signal or BOLD responses (i.e. ). The convolution step can be modelled as multiplying the activity inducing signal with a Toeplitz matrix whose columns are shifted HRFs every TR. Percentage signal changes of the fMRI signal acquired at TEk can be modelled as the sum of the hemodynamic signal scaled by TEk (i.e. ), fluctuations of the net magnetization (∆ρ(t)), and other noisy sources (e.g. thermal noise) (∆n(t)). The percentage signal changes of all echoes (or their MEICA denoised versions) are concatenated and input to ME-SPFM algorithm, which solves a regularized least squares problem, to obtain estimates of the activity inducing signal.

