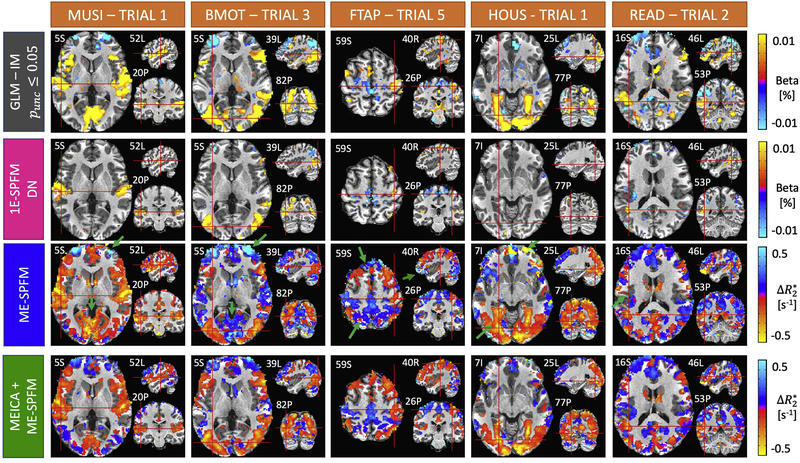
Figure 2.
Activation maps of an individual single-trial event for each experimental condition obtained with an individually-modulated (IM) GLM analysis (T-test, uncorrected p ≤ 0.05) (first row), 1E-SPFM (second row), ME-SPFM (third row) and MEICA+ME-SPFM (fourth row). The maps of IM-GLM and 1E-SPFM show estimated beta coefficients in signal percentage change (i.e. % amplitude), whereas ME-SPFM and MEICA-ME-SPFM show estimated values in units of s−1. Note the ME-SPFM and MEICA+ME-SPFM activations maps are shown with reverse colorbars so that negative (positive) values shown in red (blue) induce positive (negative) BOLD signal changes.

