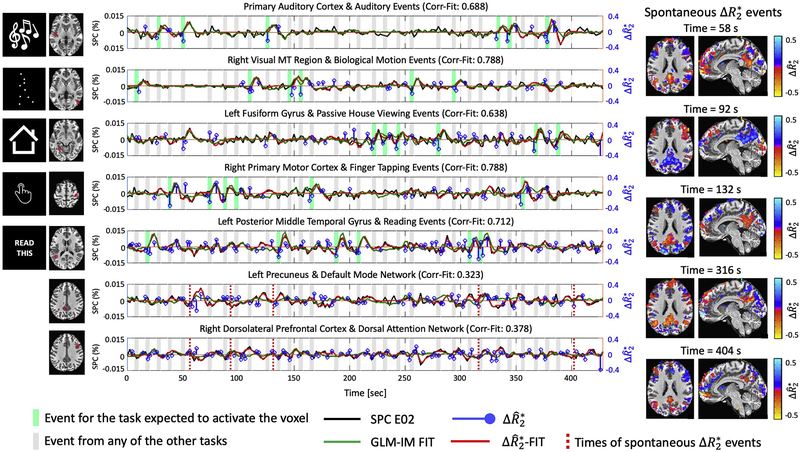
Figure 3.
Time courses of signal percentage change in E02 dataset (SPC E02, black line), GLM-IM fitted signal (green), (blue) and BOLD estimates, i.e. convolved with canonical HRF (red) obtained with MEICA+ME-SPFM in seven representative voxels in task-related regions, and left precuneus and right dorsolateral prefrontal cortex (DLPFC) of the same dataset as Figure 1. The voxel’s location is shown in the left maps. Dark and light grey bands indicate the times of trials of the relevant task for each voxel and the rest of the tasks, respectively. The maps shown on the right display instances of spontaneous events occurring at rest, whose timing is marked with dashed lines in the time courses of the left precuneus and right DLPFC.

