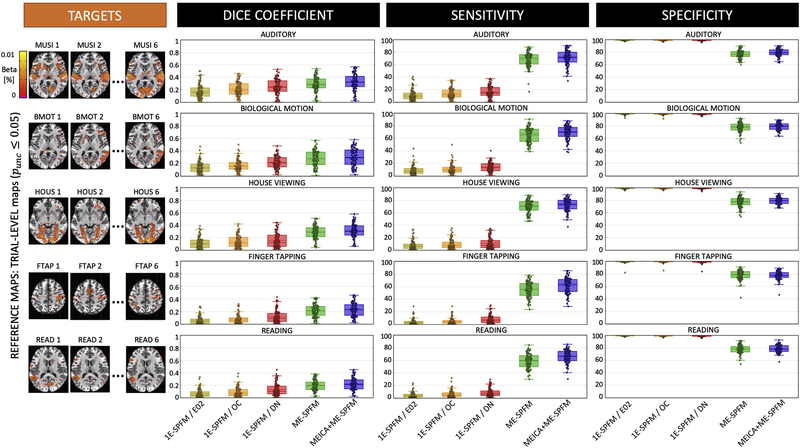
Figure 5.
Dice coefficient (i.e. spatial overlap), sensitivity and specificity values of the single-trial activation maps obtained with 1E-SPFM, ME-SPFM and MEICA+ME-SPFM for each of the experimental conditions. Each box depicts the median and the mean (dashed line) across all trials. Its width is defined by the interquartile range (IQR) defined by the 1st quartile (Q1) and 3rd quartile (Q3) quartiles. The whiskers define the 1.5xIQR below Q1 and 1.5xIQR above Q3. TRIAL-LEVEL activation maps thresholded at uncorrected p ≤ 0.05 (IMp05) and only including voxels with positive activation were used as reference maps, shown on the left for a representative dataset. The 1E-SPFM activation maps were computed from the E02, OC and DN (i.e. MEICA and OC) preprocessed datasets.

