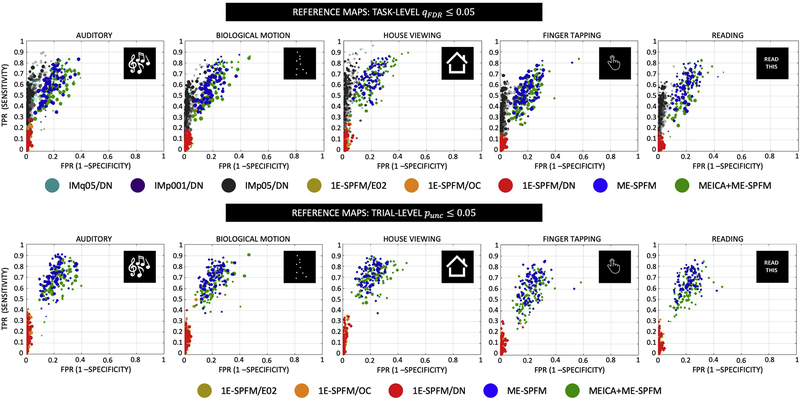
Figure 6.
Receiver operating characteristic (ROC) curves with the sensitivity and specificity of each individual trial’s activation map for all conditions and the two types of reference maps: TASK-q05/DN (top) and IM-p05/DN (bottom). The number of dots per type of analysis is the total number of trials across all datasets (i.e. 16 datasets with 30 trials each equals 480 trials). For visualization purposes, only the IM-q05, IM-p001 and IM-p05 with the DN dataset are shown in the ROC plots at the TASK-LEVEL. The radius of each circle is relative to the number of positives in the reference map, i.e. trials with bigger circles activations had more activated voxels in the reference maps, wherein the largest radius is the maximum number of positives across all trials and conditions. For the TASK-q05/DN plots, the maximum/minimum number of positives for each task were: 57558/7278 for MUSI, 60915/8210 for BMOT, 37303/8089 for HOUS, 53249/10456 for FTAP, 46860/5542 for READ. For the IM-p05/DN plots, the maximum/minimum number of positives for each task were: 50825/1120 for MUSI, 59764/1892 for BMOT, 39137/2603 for HOUS, 33380/804 for FTAP, 29539/933 for READ.

