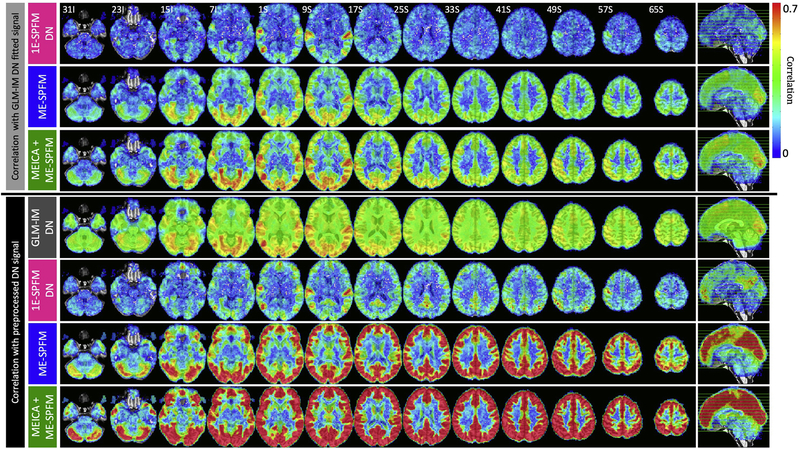
Figure 7.
(Top three rows) Maps of Pearson’s correlation coefficients between the BOLD signals estimated with the GLM-IM analysis and the BOLD signals estimated with the 1E-SPFM, and ME-SPFM and MEICA+ME-SPFM deconvolution algorithms. (Bottom four rows) Maps of Pearson’s correlation coefficients between the preprocessed DN dataset and the fitted signals estimated with the GLM-IM analysis, and the 1E-SPFM, and ME-SPFM and MEICA+ME-SPFM deconvolution algorithms.

