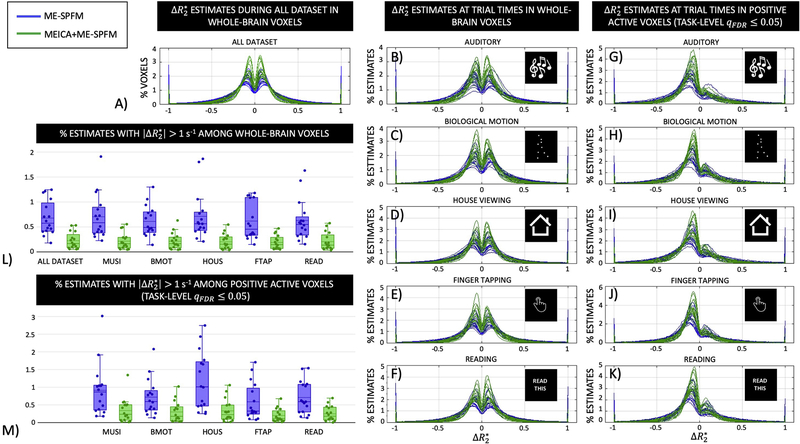
Figure 8.
Histograms of values estimated with ME-SPFM (blue lines and boxes) and MEICA+ME-SPFM (green lines and boxes) in: A) whole-brain voxels during the entire dataset, (B-F) in whole-brain voxels during times of trials for each condition, and (G-K) in voxels with positive activation according to the TASK-LEVEL IMq05 activation map during the times of trials for each condition. (L-M) Box plots with the percentage of voxels with for the analysis, showing one circle per dataset.

