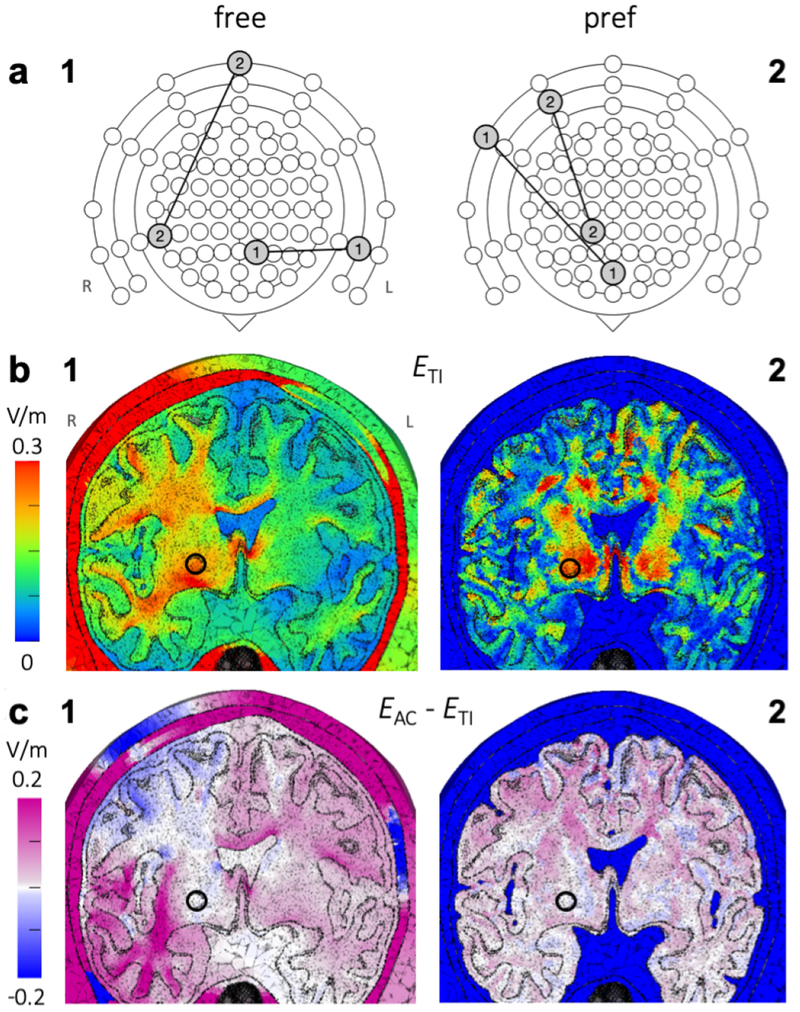
Figure 11: Study 3 – Optimal current patterns and electric fields for four-electrode tTIS and tACS in the right pallidum.
a) Current patterns that minimized the stimulated brain volume (Vol0.25) while reaching a field strength of at least 0.25 V/m in a spherical ROI in the right pallidum for tTIS in a free (1) or preferred direction (2). Each electrode pair was represented by a line connecting two circles on an extended schematic of the 10-10 system; three rings were added around the standard schematic (Fig. 7a) to represent electrodes on the neck and cheeks (Fig. 10a) and the schematic was rotated 180 degrees to aid interpretation of panel b. For both current patterns, the input currents of each pair were equal (I2 = I1, R = 1). b) Optimal ETI (fields resulting from the current patterns in panel a), and c) difference between optimal EAC and optimal ETI, on a plane through the target region (indicated with a circle) for free (1) and preferred (2) directions, viewing towards the posterior direction (L and R in panel b1 indicate the left and right side of the head for all panels). Optimal current patterns for EAC are shown in Fig. S11.

