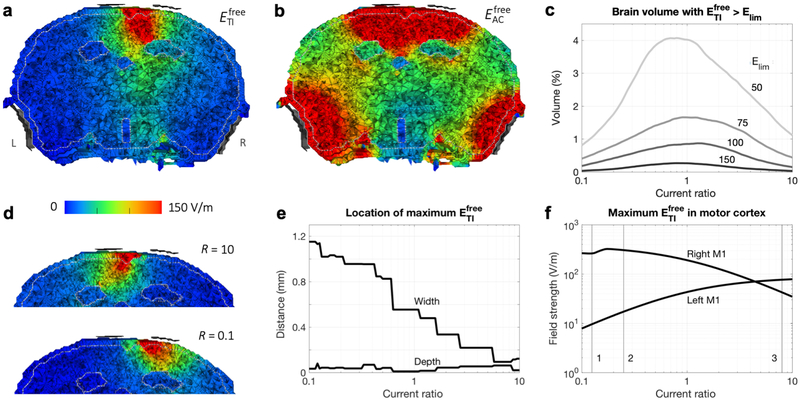
Figure 4: Results of simulations with the murine model.
a,b) IL = IR = 0.388 mA. Electric field strength on a plane through the electrodes (viewing towards the anterior direction; L and R in panel a indicate the left and right side of the head for all panels) for tTIS (a) and tACS (b). Maxima in the brain were 383 V/m for and 38 kV/m for . The four electrodes (gray) were displayed at a short distance from the head for visualization purposes. The distinct areas with low field strengths are the ventricles. c-f) Current ratios R = IR/IL varied from 0.1 to 10 with IL + IR = 0.776 mA. c) Percentage of brain tissue with above various limits (limit values indicated in the plot in V/m; total brain volume: 465 mm3). d) for extreme values of R (compare to R = 1 in panel a). See Fig. S2 for corresponding animations with intermediate R for tTIS and tACS. e) Distance of the location of maximum in the brain to the midline (“width”, positive values indicate a location to the right of the midline) and skull surface (“depth”). Lines are not smooth due to the finite size of elements in the model. f) Maximum in left and right motor cortex. Numbered lines indicate ratios that elicited the largest movements in the Grossman et al. (2017) experiments for 1: left forepaw; 2: left whiskers; 3: right forepaw and right whiskers.

