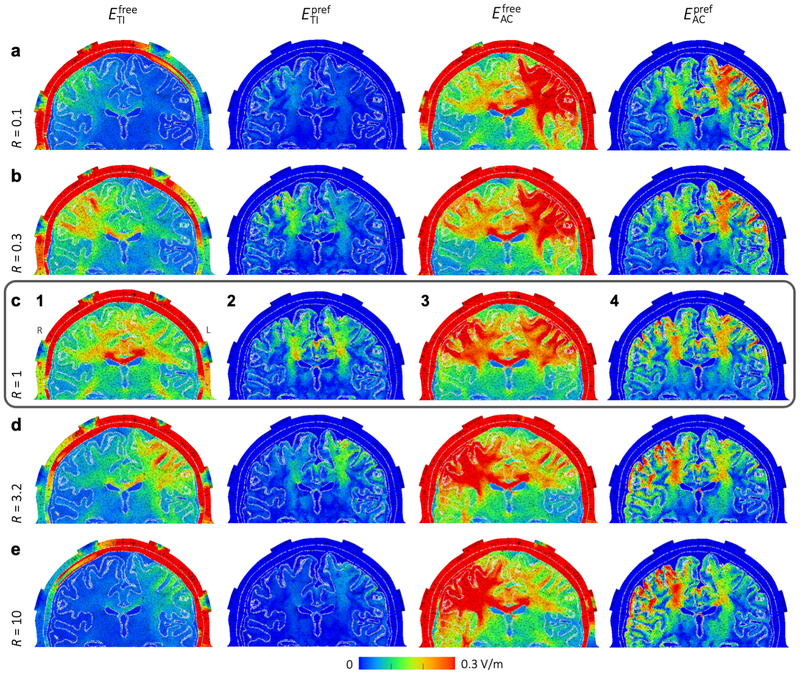
Figure 5: Study 1 – Field strength distributions for tTIS and tACS with various current ratios.
Field strengths are displayed on a plane through the electrodes (all placed in the coronal plane), viewing towards the posterior direction (L and R in panel c1 indicate the left and right side of the head for all panels). From top to bottom, the current ratio R = IR/IL is increased from 0.1 to 10. Equal current amplitudes, R = 1, are shown in the middle row, indicated with a surrounding box. From left to right, , , and are displayed. Since the preferred direction is only defined for brain elements, all non-brain elements have a value of 0 for plots of and . Note that since we are displaying electric field strength, values will be high in areas with low conductivity (such as the skull) and low for highly conductive regions. See Fig. S3 for corresponding animations for intermediate current ratios, and Fig. S1 for visualizations of the directions of EL, ER, , and .

